About
The Gena Dashboard is a Streamlit application designed for digital twin analysis and visualization. It provides an interactive interface for processing, analyzing, and interpreting digital twins through various bioinformatics workflows.
The aim is to simplify the use of the Gena Brick by providing an application that makes running the pipeline and retrieving results easier. Dependencies between scenarios are also maintained, allowing you to navigate more easily.
This standalone dashboard only allows users to visualise results that have already been run. However, don't hesitate to contact us to arrange a demo of the full app, in which we can also run analyses automatically!
Multi-Step Analysis Pipeline
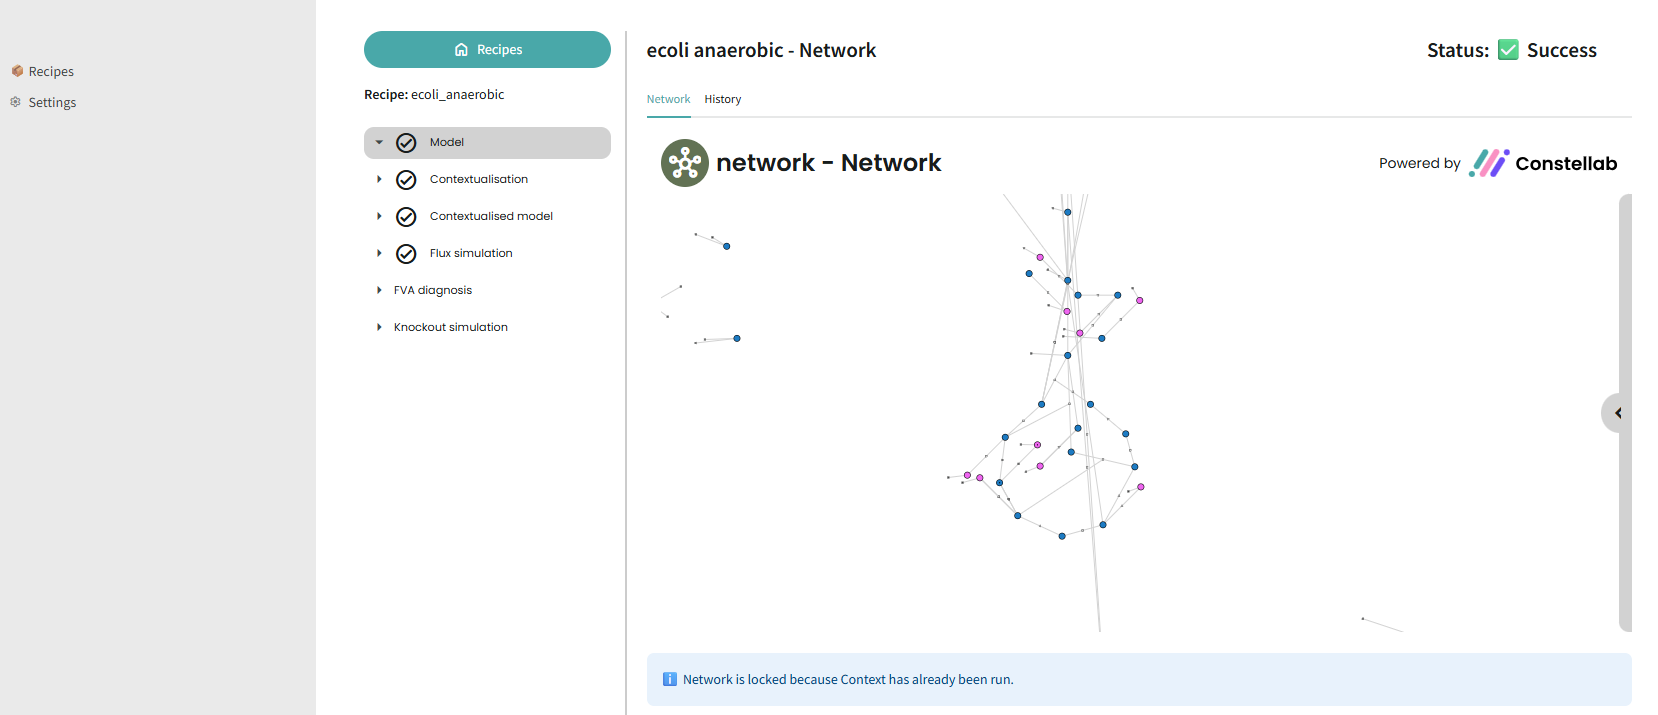
The dashboard implements a structured analysis workflow with the following steps:
- Network: Create a network and enable users to modify it through various tasks: Network, NetworkImporter, GapFiller, IsolateFinder, LoadBiggModels, NetworkMergem, NetworkMerger, OrphanRemover, ReactionAdder, ReactionRemover, TransporterAdder,
- Context: Provide an existing context or create one: Context, ContextImporter, ContextBuilder
- Twin Builder: Create the digital twin: TwinBuilder
- Perform various flux analyses: FBA, FVA, KOA
- Twin reducer: Reduce the twin: TwinReducer
Comments (0)
Write a comment