The Ubiome Dashboard is a Streamlit application designed for microbiome data analysis and visualization. It provides an interactive interface for processing, analyzing, and interpreting 16S rRNA sequencing data through various bioinformatics workflows.
The aim is to simplify the use of the Ubiome Brick by providing an application that makes running the pipeline and retrieving results easier. Dependencies between scenarios are also maintained, allowing you to navigate more easily.
Multi-Step Analysis Pipeline
The dashboard implements a structured analysis workflow with the following steps:
You can find a detailed description of the entire pipeline here.
How to start?
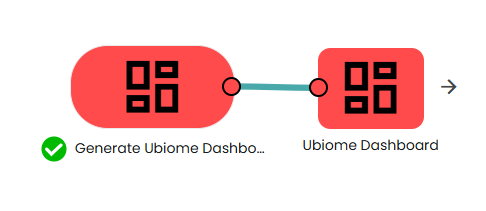
Open a new scenario and add the Generate Ubiome Dashboard app task. Then, configure the parameters: choose whether each scenario must be associated with a folder in your space, and you can add the credentials of a larger lab. This could be useful for the final step, '16S'. Finally, run the task and open the Streamlit resource.
This dashboard enables you to perform new analyses and navigate through previous results.
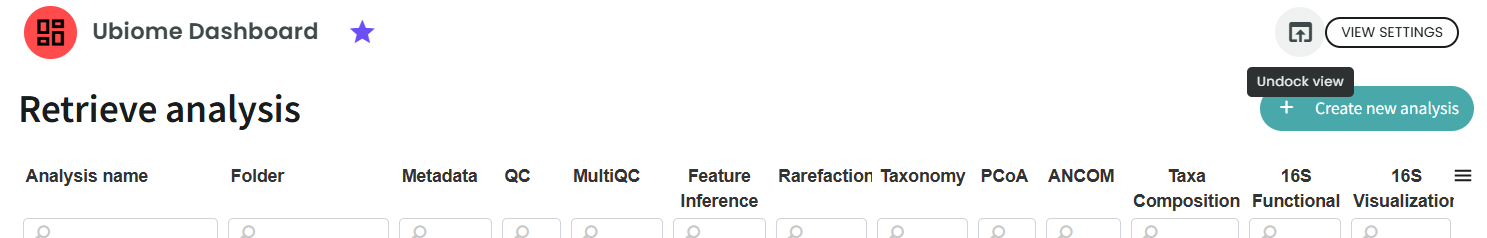
On the first page, you will see an overview of what has already been run and the status of each step.
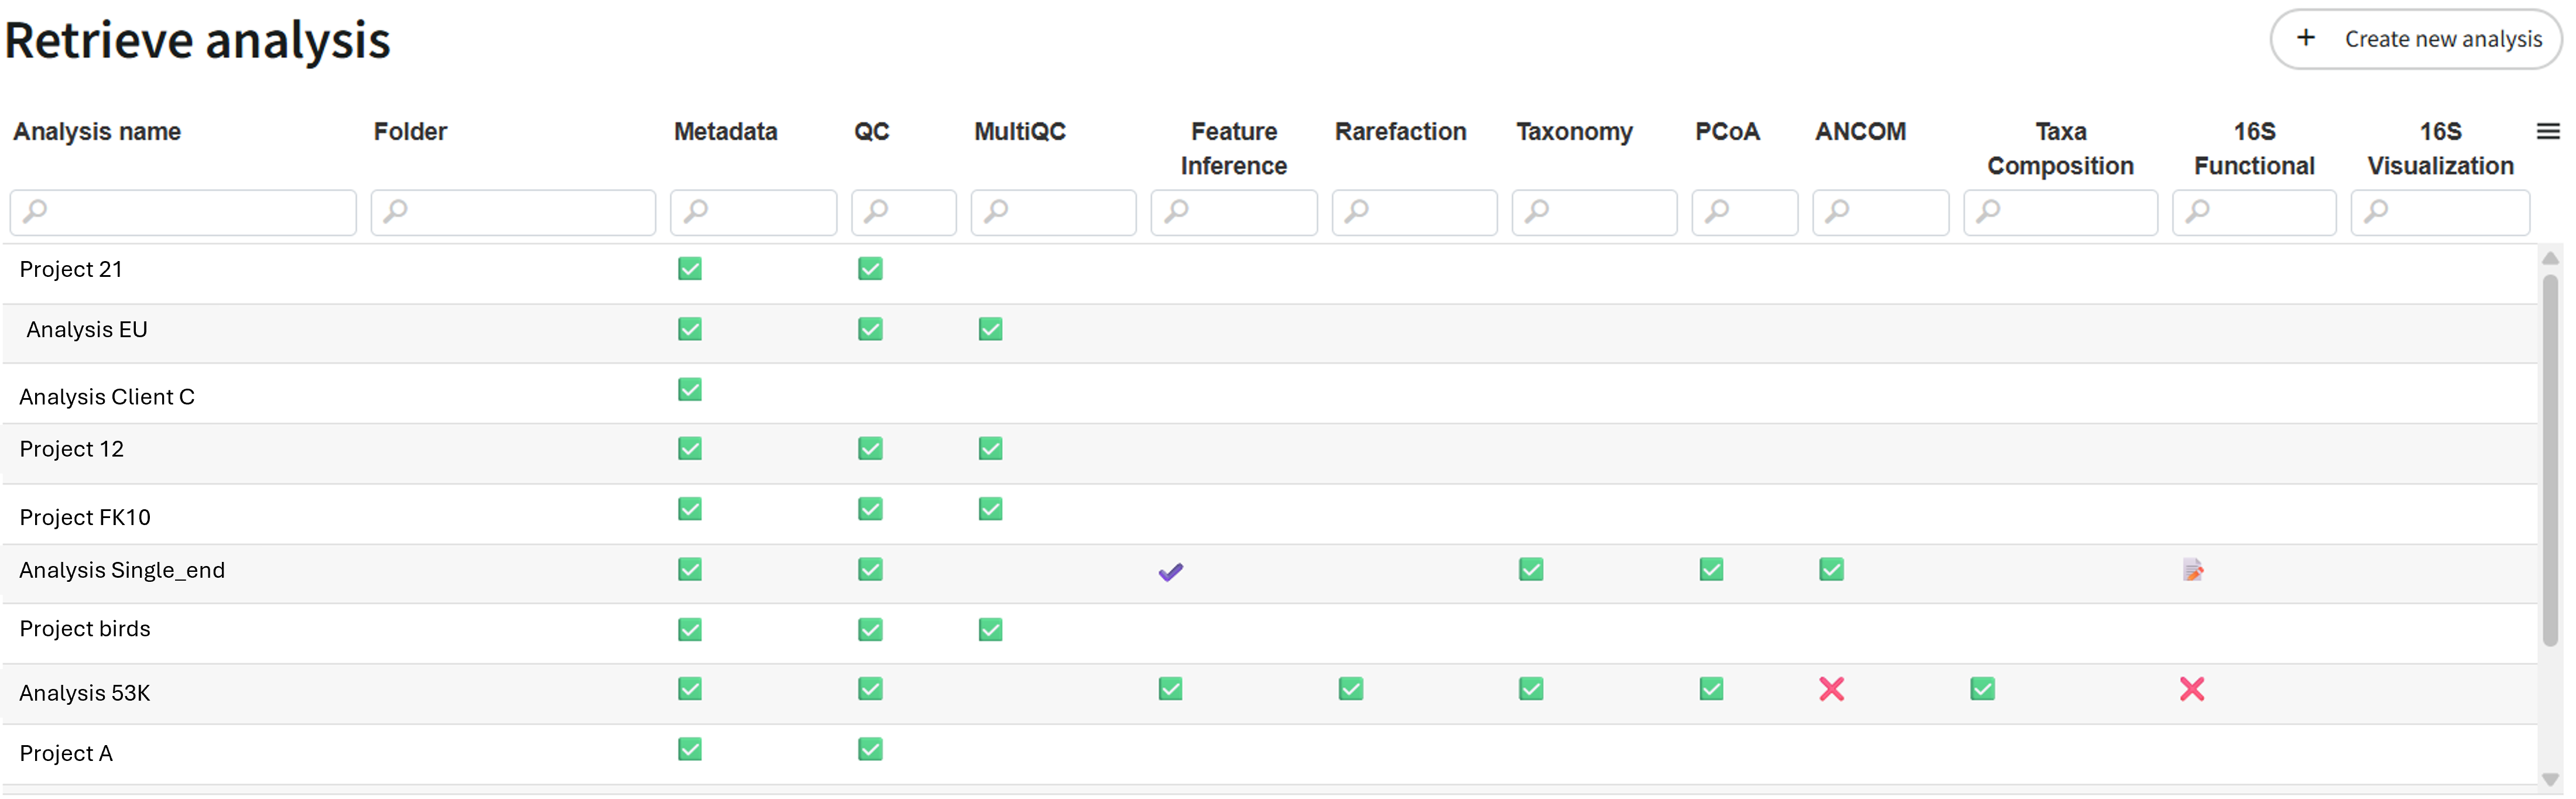
You can also click on the button "Create new analysis" to run a new analysis. You need to have a FastQ folder.
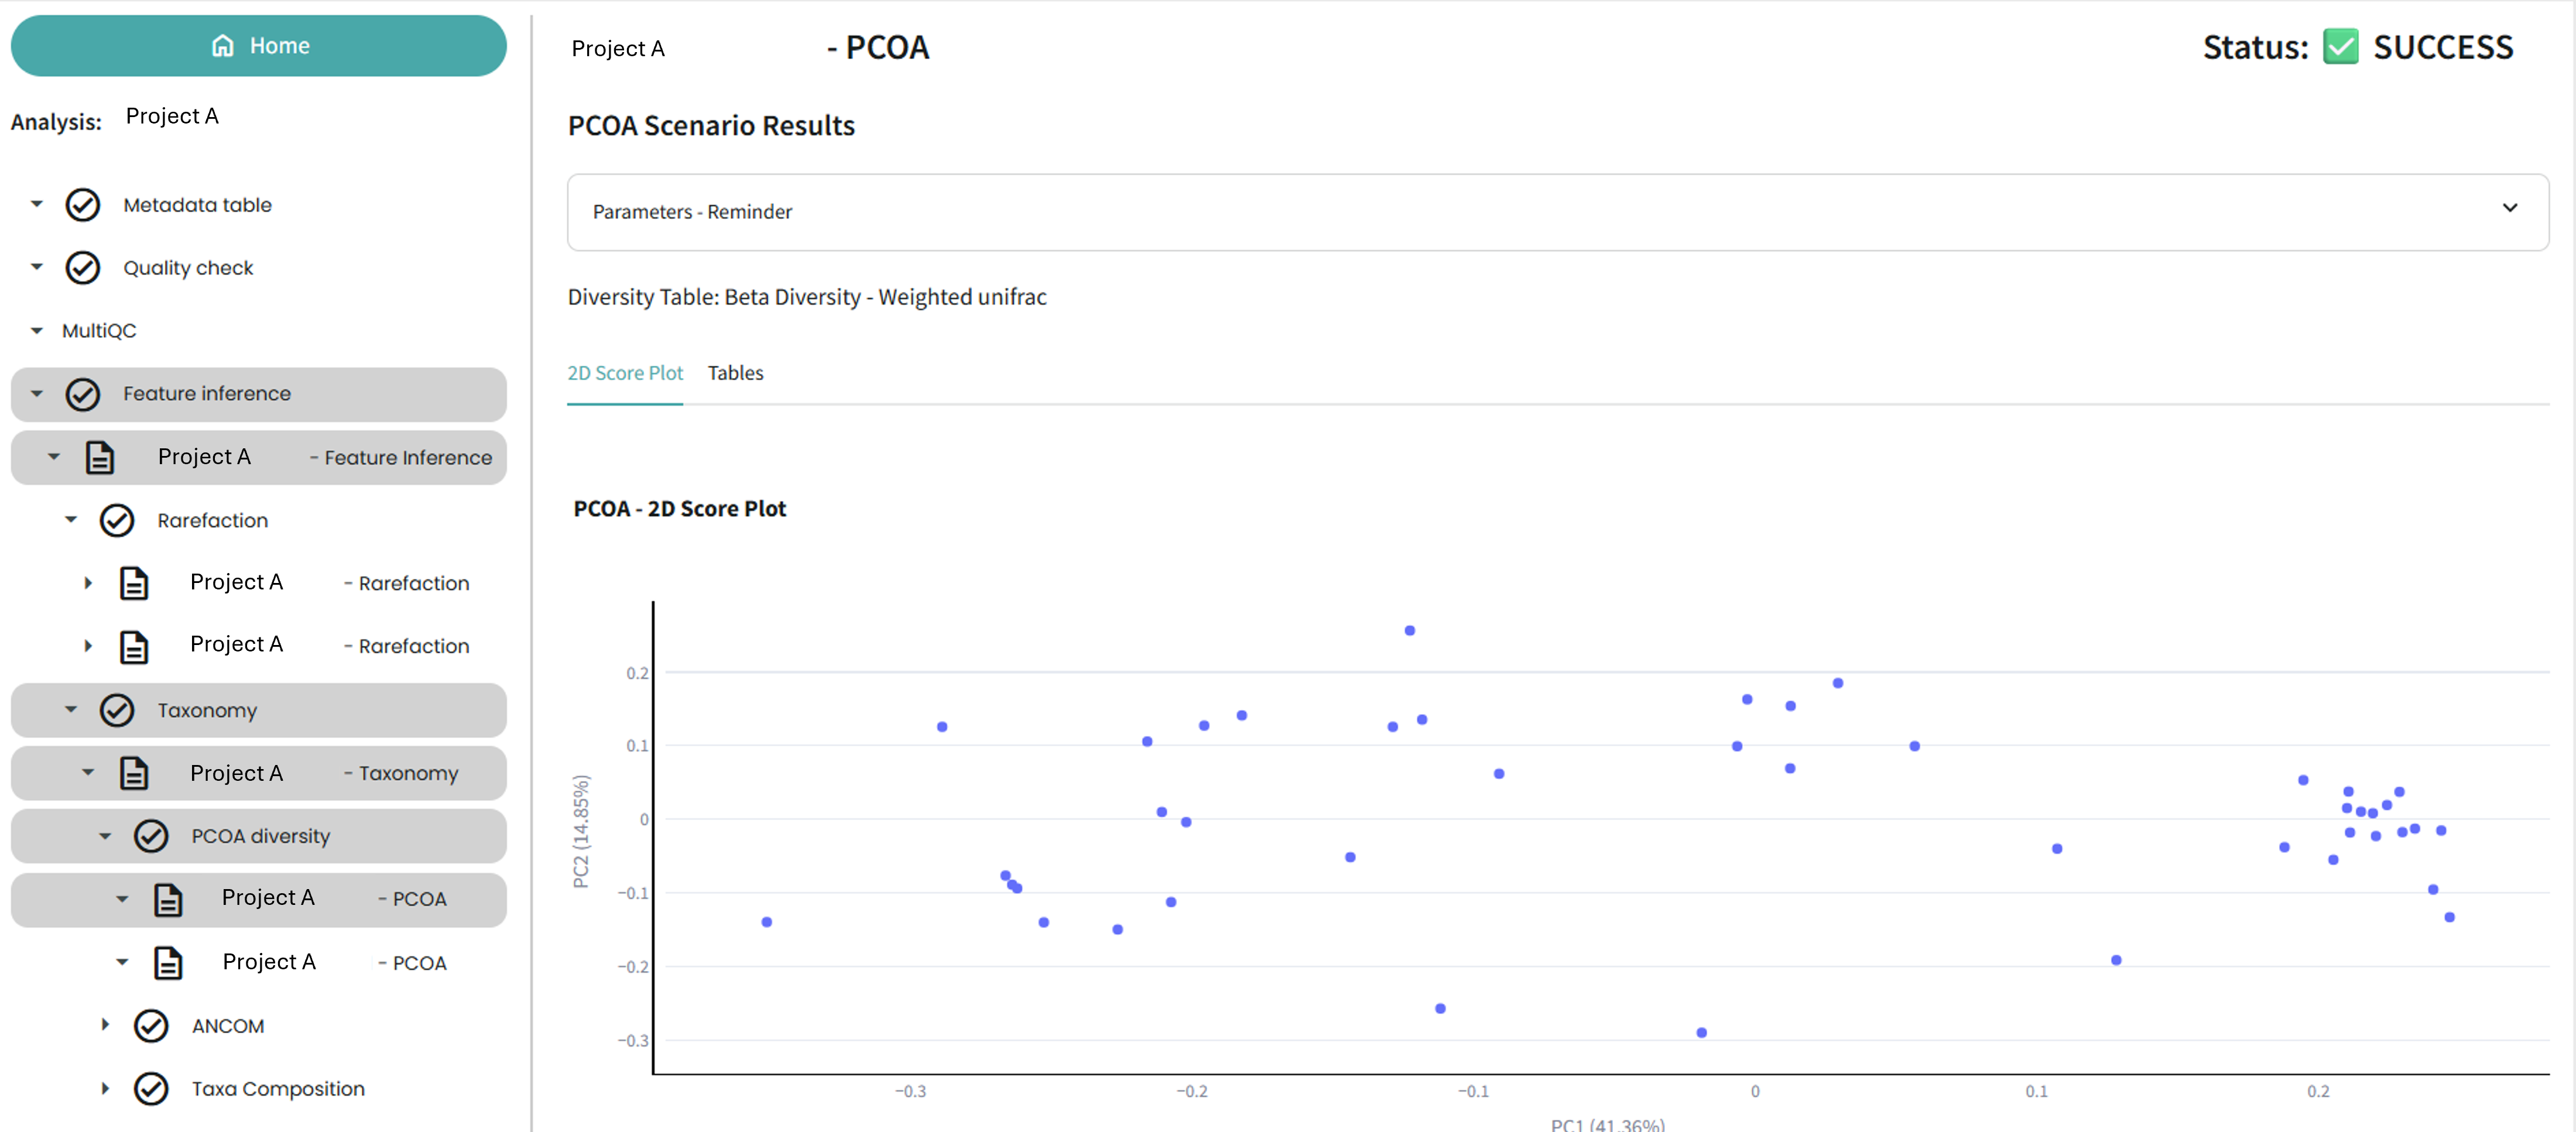
Once you have clicked on an analysis, you will see the details of each step and have the option to launch some analyses.
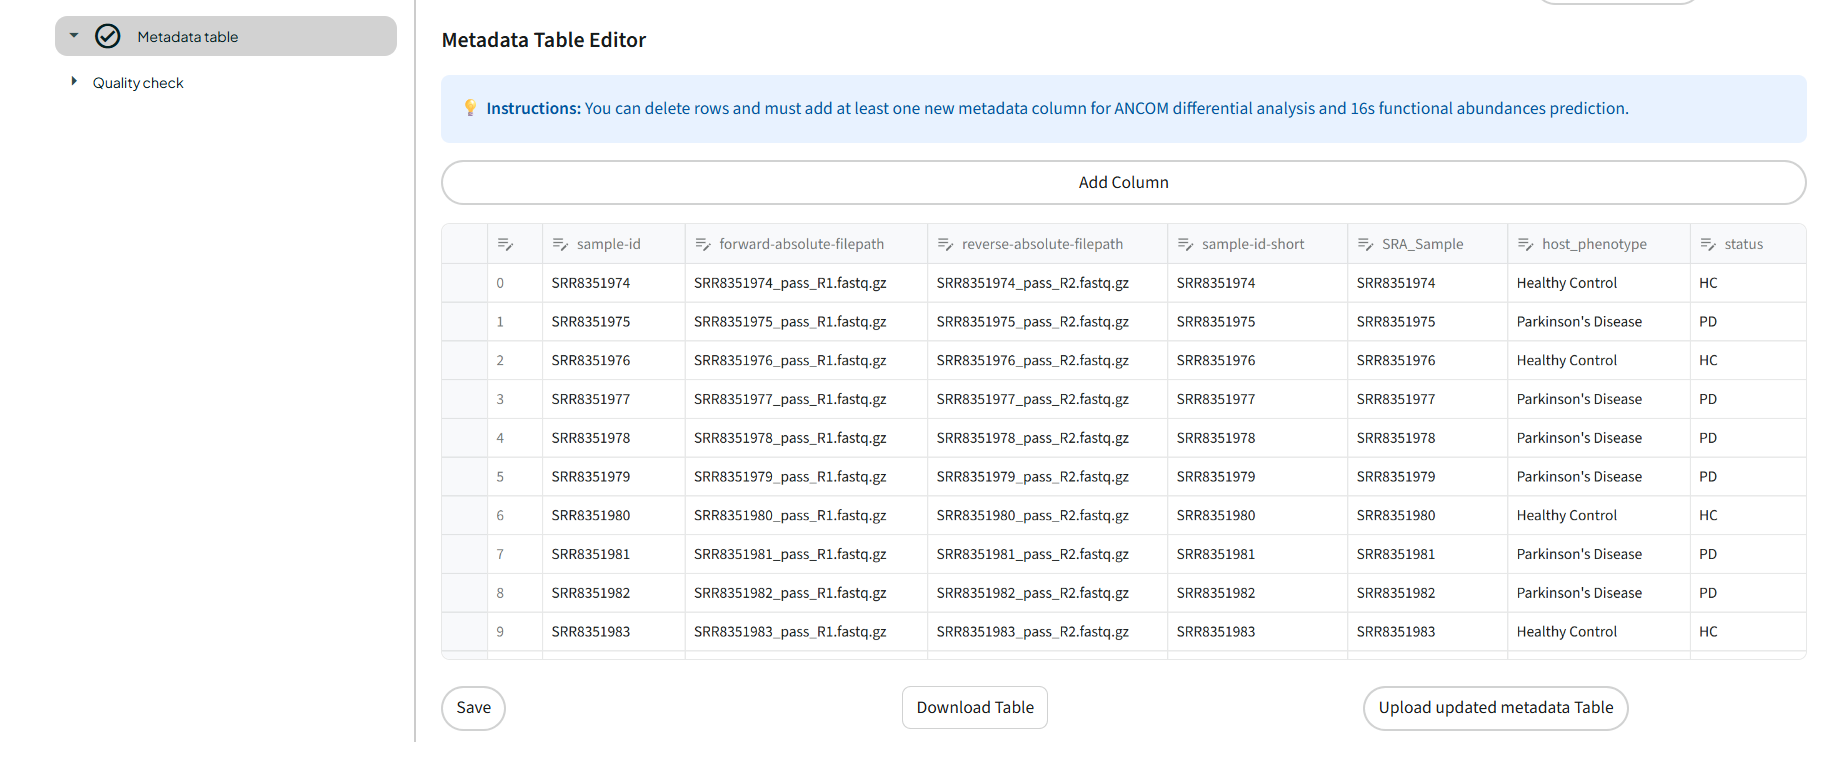
Metadata
In the Metadata step, you will see the table that was created using the Qiime2 metadata table maker task.
You will need to edit this table to specify the conditions that you are testing for, for example control VS disease. This information will be important for the final steps of the pipeline, such as ANCOM differential analysis and 16S functional abundance prediction.
Therefore, you need to add at least one column to specify this information. You can also edit the sample names to shorten or clarify them.
You can edit the table directly in the dashboard and save it, or download it, fill it in locally, and then upload it again if that is easier for you.
To do so, click on 'Download table' at the bottom of the table. You will obtain a .tsv file. Open this file in your preferred application, make any necessary modifications, and save it in .tsv format. Then click on the 'Upload updated metadata Table' button at the bottom of the table and browse for your file. The table will then be reloaded with your data.
16s Functional Analysis Prediction
At this stage, the scenario does not run automatically because this task requires a lab with more RAM. We suggest a lab with 8 CPUs. and 32 GB RAM.
This creates the scenario in your actual lab, but does not run it. The dashboard gives you a link to the scenario.
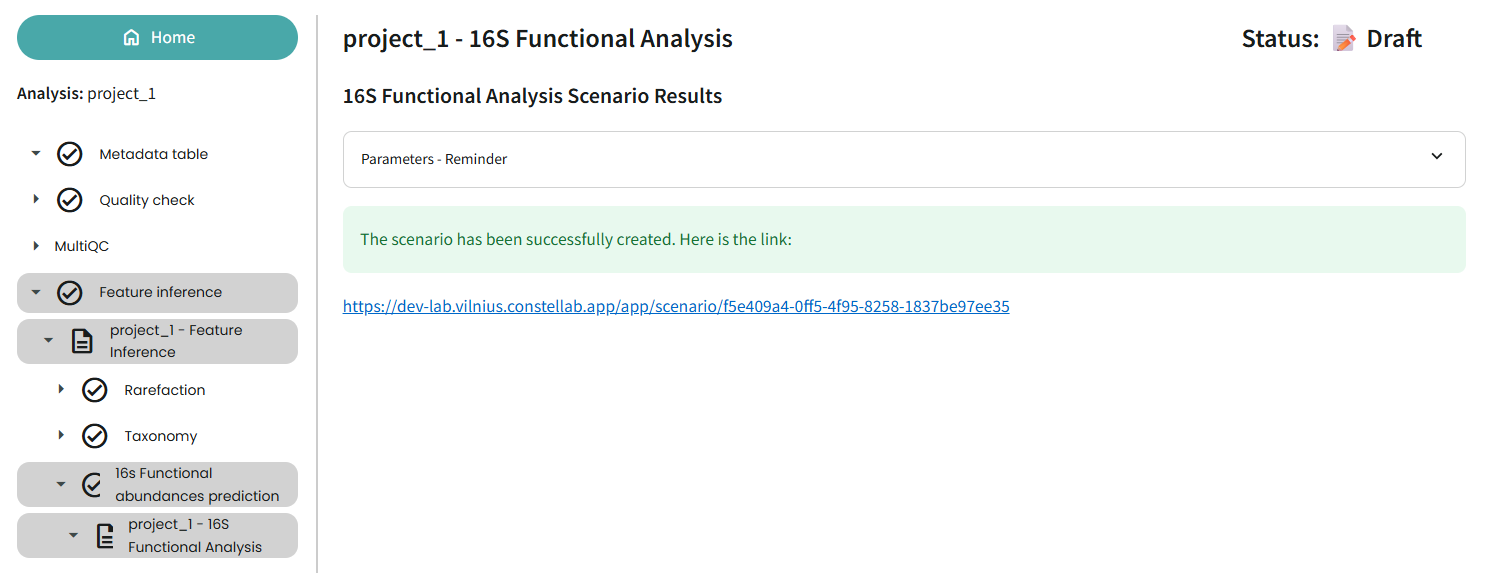
So, how do you proceed?
Click on the link to open the scenario, which you then need to share with your larger lab.
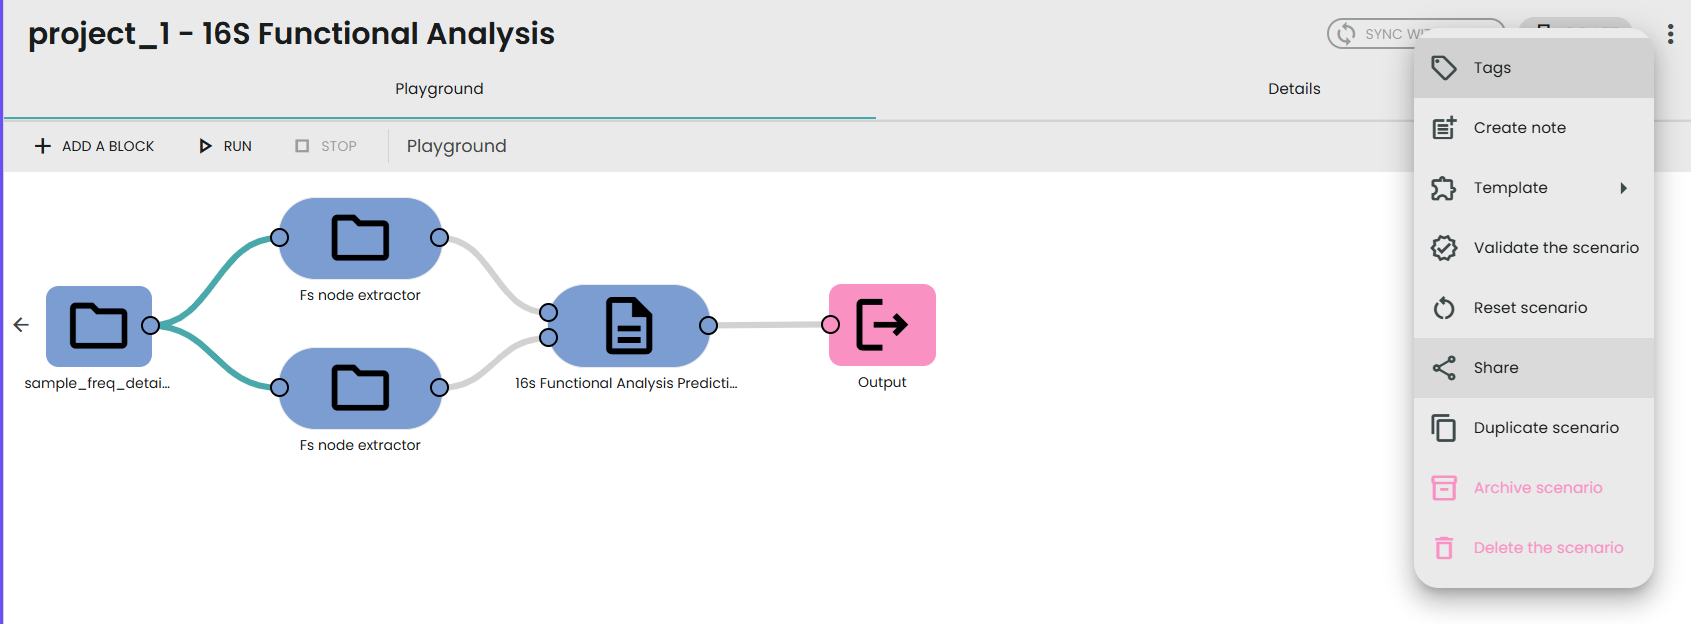
To do this, click on Share, then Send scenario to lab. Select the credentials to communicate with your lab large and select All for resource mode.
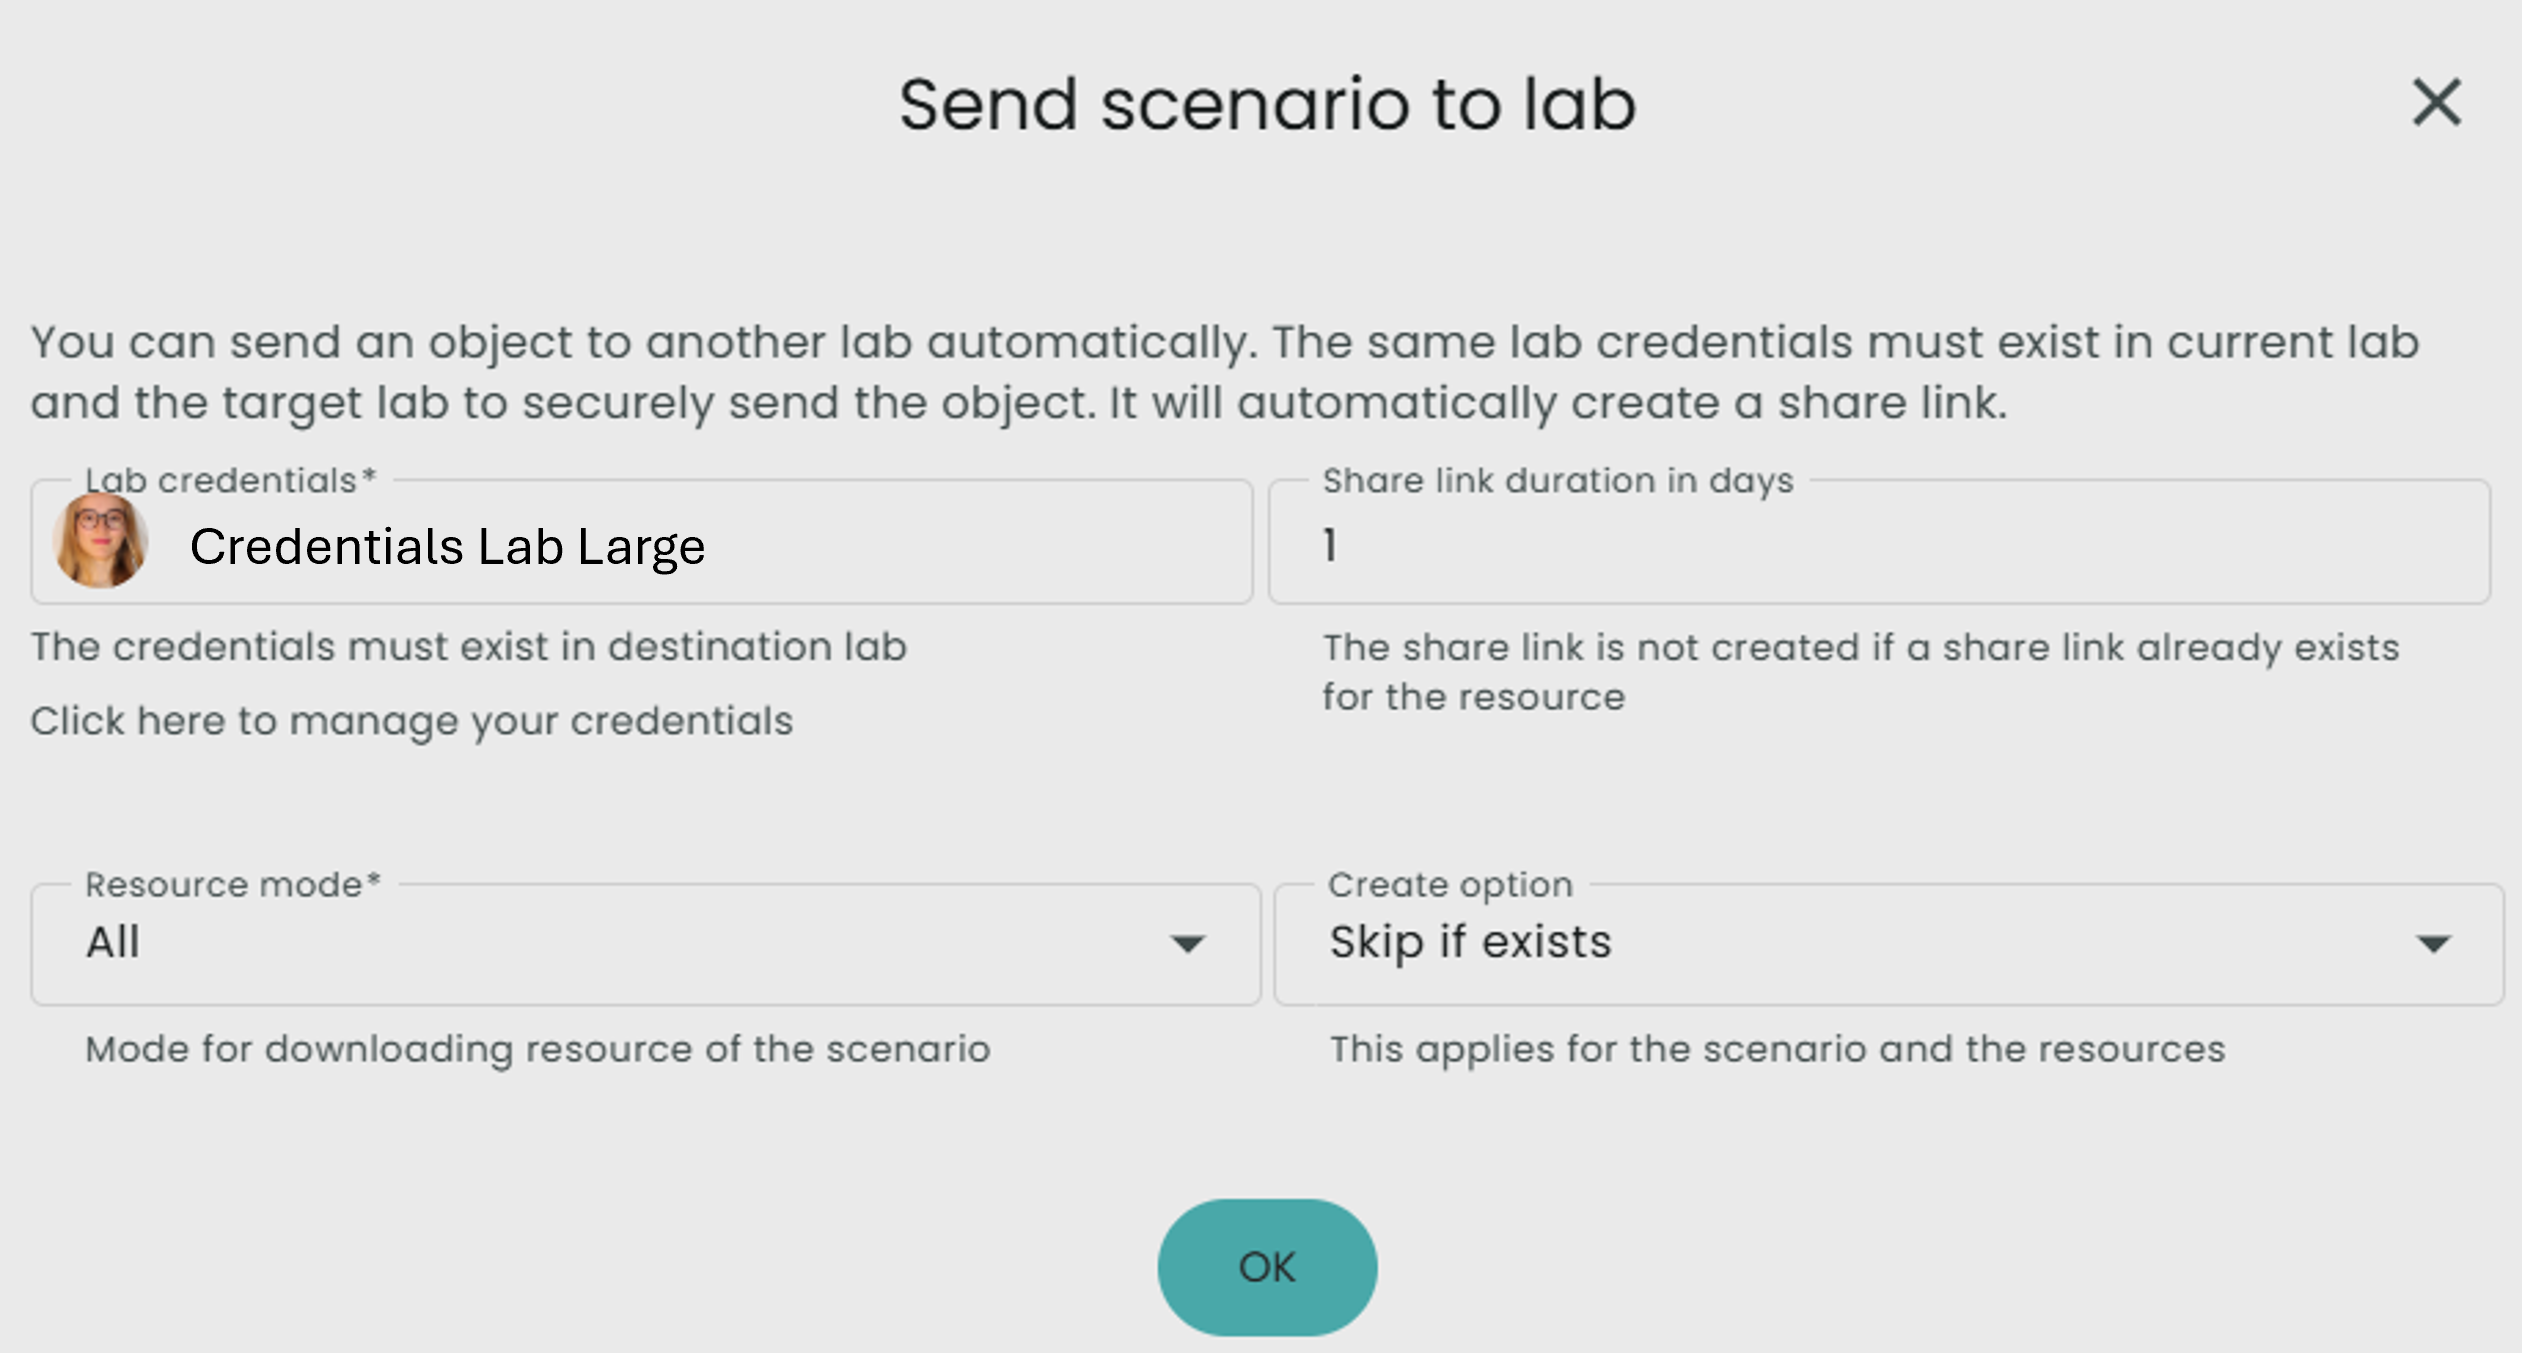
- If you would like more detailed documentation on sharing a scenario, it can be found here.
Then open your largest lab and run the scenario. Once you have done this, you can view the results and even add the 16s Functional Analysis Prediction Visualization task if you wish.
FAQ
Q: How should I begin?
Click 'Create new analysis' to launch your first scenario. This step involves taking a FASTQ folder and running the Metadata task. Once this step has been completed successfully, you can click on the first analysis in the table to view the metadata results, modify the table and run the other steps!
Q: How can I view my entire analysis?
Simply click on the desired analysis in the table on the home page and you will be redirected to the analysis details, where you can see all the steps.
Q: Why do I need to add at least one column to my metadata table?
This step is mandatory because you will need it for differential and 16S analyses. For these tasks, you need to provide a column name where you have set the metadata information. For example, you could have a 'Treatment' column where you specify which samples are control and which are treated.
If you do not want to perform these analyses, you can add a new column and set all the values to 'nan'. However, we recommend adding some information to discriminate your samples and to help with interpretation later.
Q: How do I add a column to my metadata table?
Click on 'Add column' and enter the name of your column. Then find your new column in the table and fill in the fields by clicking on them. Don't forget to save the table once you have finished!
