Purpose
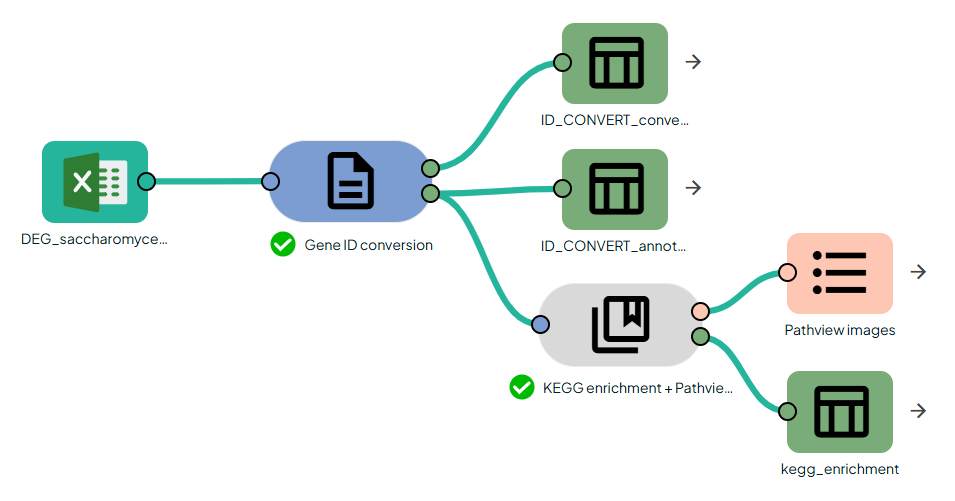
This task takes a DEG table, validates/normalizes an NCBI Entrez GeneID column, then:
- converts Entrez IDs to KEGG gene IDs (
hsa:1234, dme:xxxx, …) using KEGG REST
- builds the species KEGG universe (genes ↔ pathways)
- computes KEGG pathway enrichment (hypergeometric) + BH/FDR correction
- renders Pathview PNGs for enriched pathways, supporting multiple fold-change columns on the same PNG (Pathview multi-state →
.multi.png).
Requirements
- The analysis column must contain NCBI Entrez GeneIDs:
digits only (
1234, 318213, …)
no symbols, no Ensembl IDs, no “GeneID:…”
values like 1234.0 should be normalized to 1234 (the pipeline typically cleans this, but clean input is safer).
- digits only (
1234, 318213, …)
- no symbols, no Ensembl IDs, no “GeneID:…”
- values like
1234.0 should be normalized to 1234 (the pipeline typically cleans this, but clean input is safer).
- If you start from other identifiers (Ensembl, symbols…), first run OmiX “Gene ID conversion” to obtain ENTREZGENE.
Input
A DEG table (CSV/TSV) containing:
- one Entrez GeneID column
- optional one or more fold-change columns
Parameters
- Organism (autocomplete): scientific name (e.g., Homo sapiens, Drosophila melanogaster, Saccharomyces cerevisiae).
The task automatically maps it to the KEGG code (
hsa, dme, sce, …).
- col_entrez: column name containing Entrez GeneIDs.
- foldchange_cols (optional): comma-separated list of fold-change columns to display in Pathview.
Example:
FoldChange,FoldChange 21 column → *.pathview.png≥2 columns → *.pathview.multi.png
- min_genes_required (internal/script): minimum number of valid Entrez genes required to proceed.
Outputs
- pathways (ResourceSet): Pathview PNG images
typical names:
hsa00480.pathview.png (single FC)
hsa00480.pathview.multi.png (multiple FC)
- kegg_enrichment (Table): enrichment results with at least:
pathway, pathway_name, overlap, pathway_size, query_size, universe_size, pvalue, padj
How overlap / pvalue / padj are computed
- Universe: all KEGG genes for the species (from
link/pathway/<specie>).
- Query: your mapped genes intersecting the universe.
- For each pathway:
K = pathway gene set size in universe
n = query size
k = overlap = number of query genes in the pathway
- pvalue: hypergeometric right-tail (probability of ≥k overlaps by chance).
- padj: Benjamini–Hochberg (FDR) correction across all tested pathways.
Why can a PNG be produced with no colored genes?
Even if a pathway is enriched, Pathview may show no coloring when:
- gene IDs don’t match what Pathview expects (wrong id type / wrong formatting)
- fold-change values become NA / non-numeric after parsing
- the map contains mostly compound/KO nodes rather than gene nodes relevant to your IDs
The enrichment table remains valid; coloring depends on ID ↔ node compatibility in Pathview.
