A view in Constellab is a representation of data from a specific resource. Resources can have multiple views, such as tables or plots, to navigate through data effectively. Users can create their own views or choose from pre-configured views tailored to specific processes. The majority of views in Constellab are interactive, allowing users to zoom and customize graphs.
Views can be shared among users and added to notes for enhanced data visualization. All generated views are saved and accessible from scenarios, the Resource page, and the Views page, which stores the history of all views.
What is a view ?
A view is a representation of the data in a Resource. Each view is linked to a specific resource, and a Resource can have multiple views. For instance, a Table resource can be viewed as a table (similar to Excel) or as a plot (such as scatter plot, box plot, etc.). Both views are provided to help navigate through the data effectively.
Views can be generated from the resource page and added to notes to enhance data visualization in your notes. By utilizing views, you can present data in different formats and gain valuable insights from your resources.
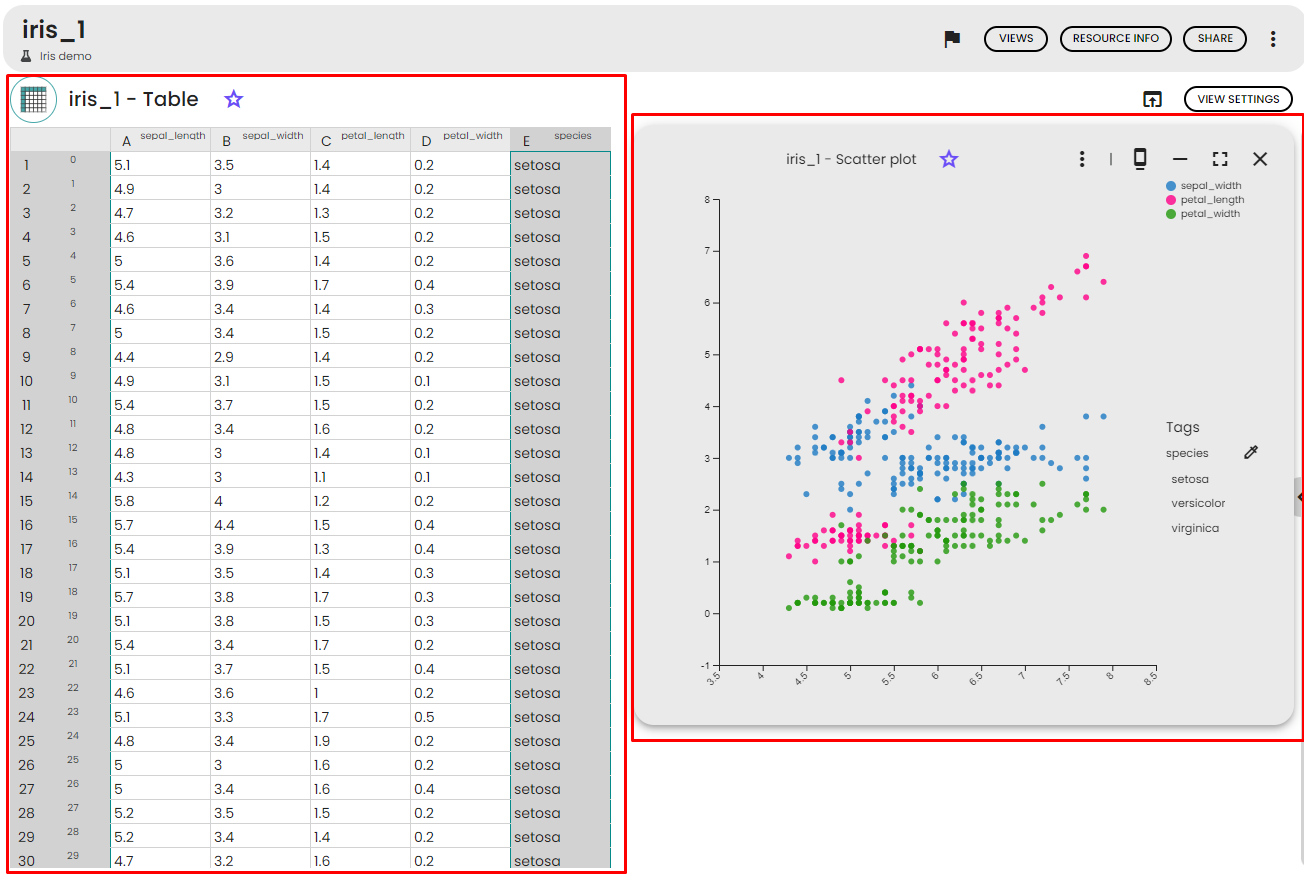
In the example below, you can see the views for a resource named iris_1, which is a Table resource. On the left side, there is the default table view, resembling an Excel-like view, displaying the data in tabular form. On the right side, there is a generated scatter plot view, which presents the data as a scatter plot. Both are views and represent different visualizations of the same resource, iris_1.
How to generate a view for a Resource?
When you open a resource, you will see the default view, but if you wish to explore your data differently, you can generate new views. The available views will depend on the type of resource you are working with. To create a new view, follow these steps:
- Open the
Resource page.
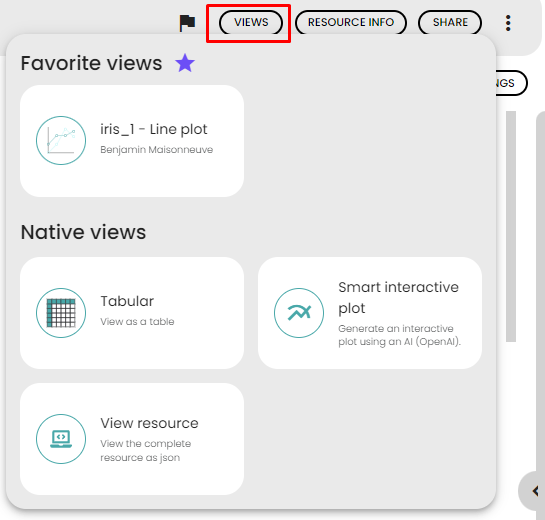
- Click on the
Views button.
- You will be presented with two lists to choose from:
- Favorite views: These are views that were previously generated and marked as favorites (refer to "How to mark views as favorite" for more information).
- Native views: These are the available views for the resource. Some of these views might require configuration before they can be displayed.
- Click on the view you want to use. If it needs configuration, fill out the required form and click on save.
- The view will then appear in a popup, showing the data in the selected visualization.
All the generated views are saved, and you can access them in the view history within the Resource info popup. This feature allows you to revisit and use previously generated views for further analysis and exploration. You can also find the generated views in the Viewbox.
How to mark views as favorite?
Views can be marked as favorites, which is a handy way to save the configuration of a view and make it easily accessible. Once a view is marked as a favorite, it will be available from the Generate Views popup, and it will be visible by default in the Viewbox.
To mark a view as a favorite, follow these steps:
- Open the view you want to mark as a favorite.
- Click on the
star button next to the view title.
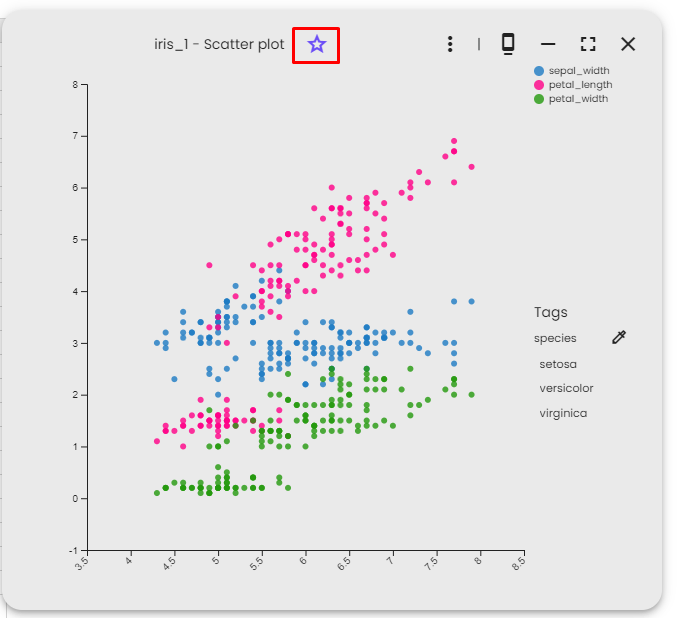
If you wish to unmark a view as a favorite, simply click on the star button again, and the view will no longer be listed as a favorite.
How to manage views?
You can perform various manipulations with views. Here are the actions you can take:
- Click on the view title to update it. This allows you to provide a more descriptive or memorable title for the view, making it easier to identify and use in the future.
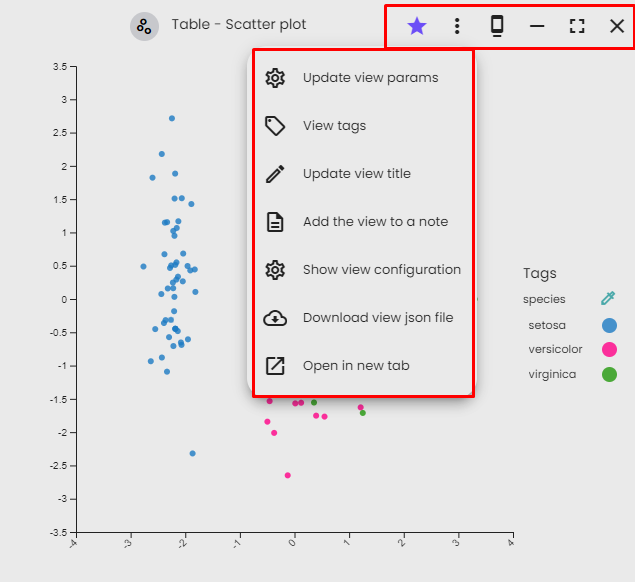
- Click on the menu button to show options for the views:
- Update view param: Modify the view parameters to generate a new view with different settings.
- Update view tags: Edit the view tags, which helps in grouping and finding resources in the
Views page.
- Update view title: Change the title of the view.
- Add the view to a note: Include the view at the end of a note of your choice (See How to add a view to a note).
- Show view configuration: view technical information of the view configuration
- Download view json file: export view as json file This is useful to integrate a view in community, see View in community
- Open in a new tab: Open the view in a new browser tab. This option is useful when you want to share the view's link with someone else.
- In the view popup, you'll find several buttons to manage the popups:
- Dock view: Replace the default view with the current view. This is helpful when you want to share the view with others.
- Minimize view: Hide the view popup and keep it for later. Minimized views are accessible at the bottom of the page for quick access.
- Fullscreen: Toggle the view to display it in fullscreen mode for a more immersive experience.
- Close: Close the view popup when you no longer need it.