Introduction
Ever since the beginning of the 21st century, we have witnessed remarkable technological advancements in biology, particularly with the emergence of high-throughput ‘omics’ techniques such as microarrays and next-generation sequencing (NGS). These approaches revolutionized genomics by enabling the simultaneous measurement of thousands of genes in a single experiment. As a result, researchers can now rapidly identify genes whose expression is associated with particular phenotypes, treatments, or conditions.
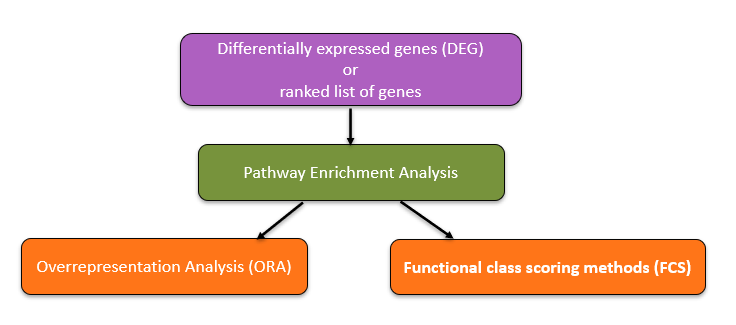
However, identifying differentially expressed genes (DEGs) is only the first step. The true challenge lies in interpreting these long gene lists in a biologically meaningful way. A list of hundreds or thousands of genes provides little insight on its own; instead, scientists need to understand which biological processes, pathways, or molecular mechanisms are perturbed. To address this challenge, a variety of computational approaches have been developed to translate raw gene-level information into interpretable functional categories. This family of approaches is collectively known as Pathway Enrichment Analysis (PEA)
The central aim of FEA is to determine whether certain biological annotations such as pathways, molecular functions, or cellular components are statistically overrepresented in a gene set of interest relative to an appropriate reference background. By linking DEGs to known biological knowledge bases (e.g., Gene Ontology (GO), KEGG pathways, or Reactome), FEA allows researchers to move from raw lists of genes to higher-level interpretations about the underlying biological mechanisms in their study system.
ORA = I have a shortlist => is this pathway overrepresented in it?
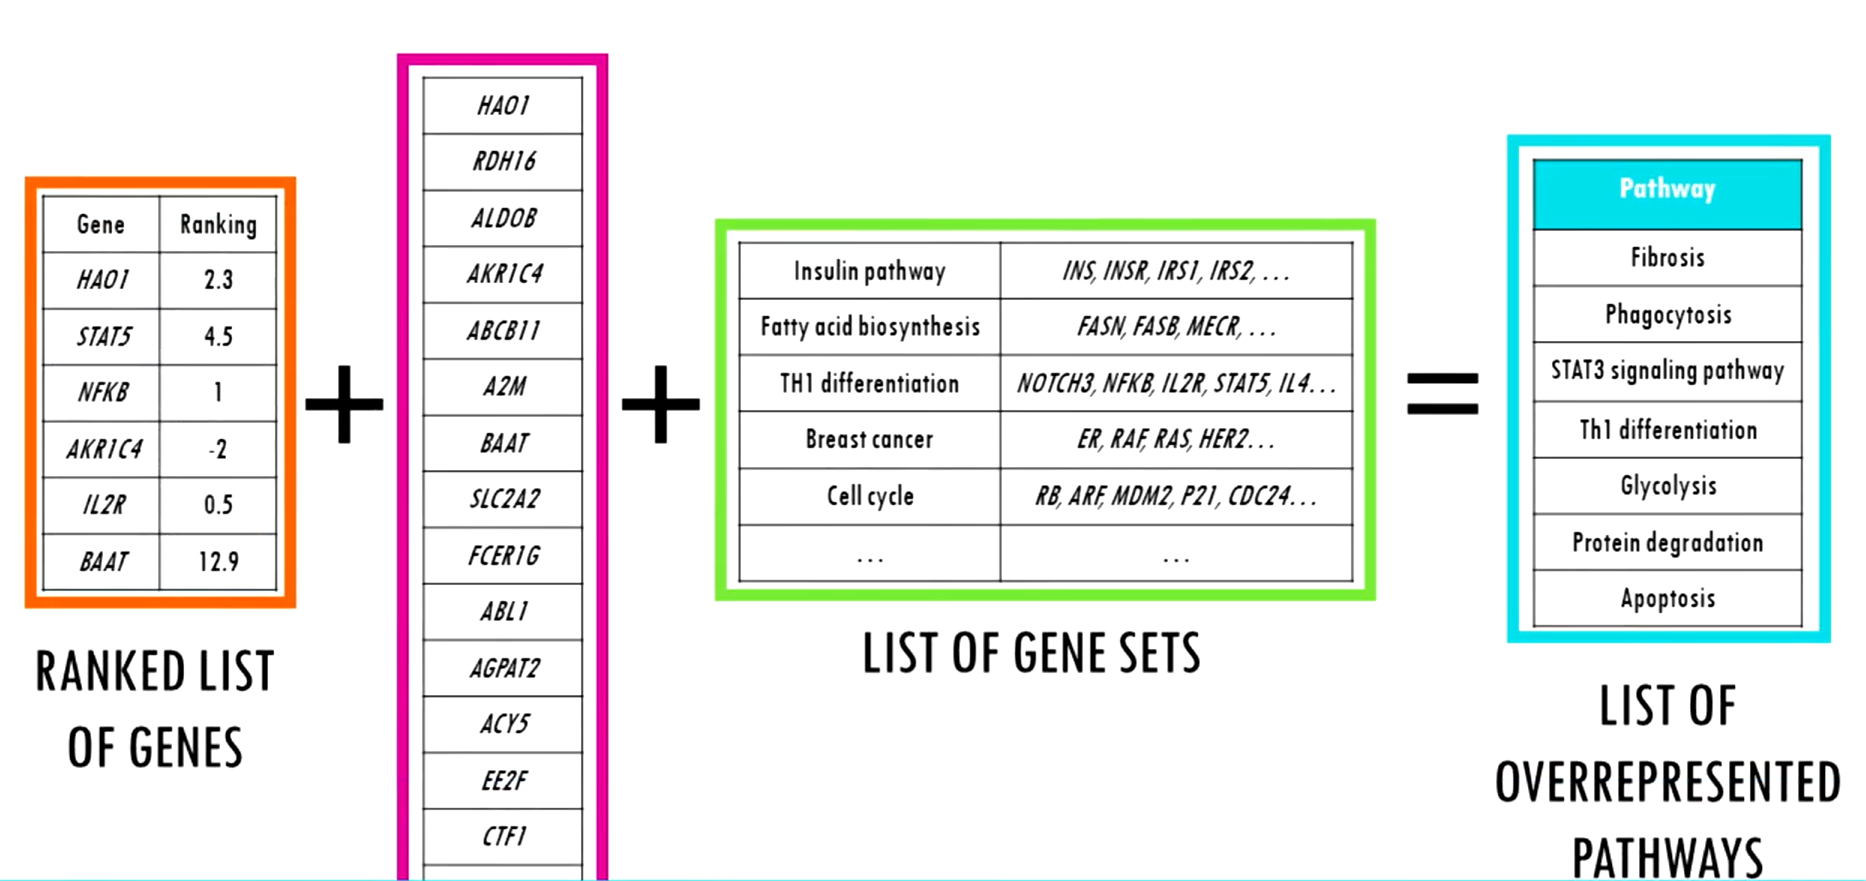
GSEA = Across the whole ranked list => do the genes from a pathway cluster toward the top or the bottom?
If you’re new to ORA, this short video explains the core idea behind Overrepresentation Analysis and how to interpret its results: (click here)
If you’re new to GSEA, this short video explains the core idea behind Gene Set Enrichment Analysis and how to interpret its results: (click here)
Methods
1. Overrepresentation Analysis (ORA)
1.1 What's ORA?
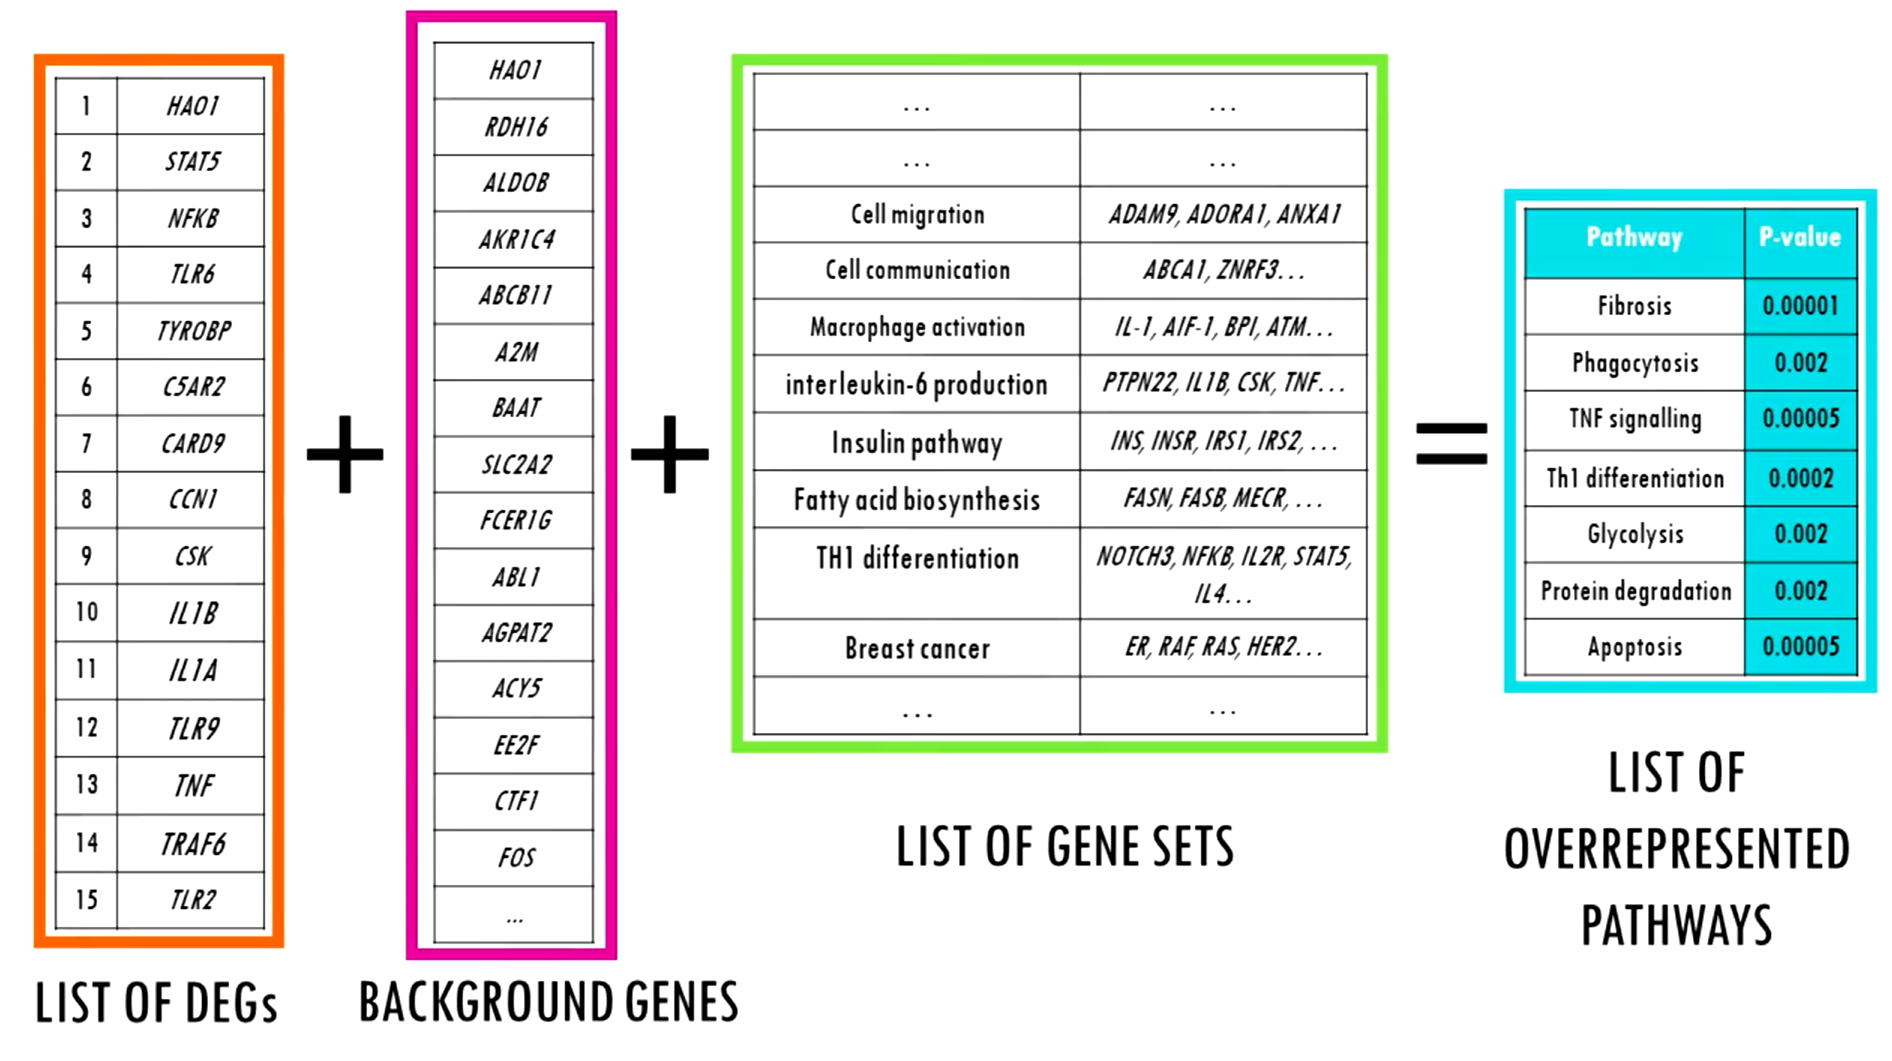
ORA is one of the most widely used and conceptually simple methods for functional enrichment. Here, the input is a discrete list of genes typically DEGs identified after applying thresholds on adjusted p-values and fold-changes.
The question ORA asks is:
Do certain pathways or functional categories contain more genes from my list than would be expected by chance?
This is statistically tested using the hypergeometric test, which assesses whether the overlap between the gene list and a given pathway is greater than random expectation.
One important consideration in ORA is the definition of the background universe. By default (auto mode), the background is set to the entire reference genome (e.g., ~20,000 genes in humans). Alternatively, in experiment mode, the background can be defined as all genes tested in the experiment (e.g., ~12,000 measured transcripts in RNA-seq). The choice of background influences the results, especially in tissue or platform specific datasets.
1.2 Tools
While several popular R packages exist for functional enrichment analysis, such as topGO and clusterProfiler, the g:Profiler ecosystem (including the R client gprofiler2) offers distinct advantages. Unlike tools that require local downloads of multiple annotation databases, g:Profiler provides access to a broad range of high-quality, regularly updated annotation sources through a single query. Its in-house database integrates only well-established and reliable resources, including Gene Ontology (GO), KEGG, Reactome, WikiPathways, miRTarBase, TRANSFAC, the Human Protein Atlas, protein complexes from CORUM, and the Human Phenotype Ontology.
Another important feature is its automatic identifier mapping: g:Profiler seamlessly handles input lists containing mixed types of gene identifiers (e.g., Ensembl IDs, gene symbols, Entrez IDs), removing a common source of preprocessing errors. This flexibility, combined with continuous updates and support for over 600 species and strains, makes g:Profiler an ELIXIR Recommended Interoperability Resource in life sciences. Overall, g:Profiler provides a user-friendly, reproducible, and comprehensive framework for conducting functional enrichment analysis without the technical burden of managing multiple annotation sources locally.
1.3 Steps
This task (task: OmiX – Functional enrichment analysis based on ORA) performs functional enrichment analysis on the list of differentially expressed genes (DEGs). It conducts Over-Representation Analysis (ORA) using a hypergeometric/Fisher’s exact test, followed by multiple-testing correction (by default via g:SCS – Set Counts and Sizes).
In this workflow, the background universe is set to auto (the whole genome as defined by g:Profiler) rather than experiment (all genes quantified in the dataset). This choice ensures consistency with the g:Profiler web interface, where only terms passing the corrected significance threshold (adjusted p-value ≤ α) are retained.
🧰 Prerequisites
- Access to Constellab and a valid Digital Lab environment
- Installed bricks: gws_omix ≥ 0.13.10
Parameters:
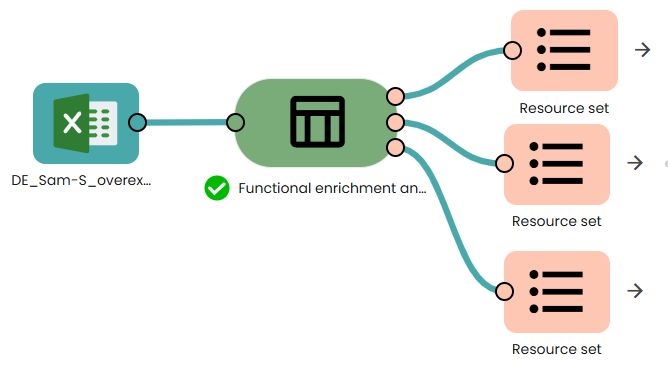
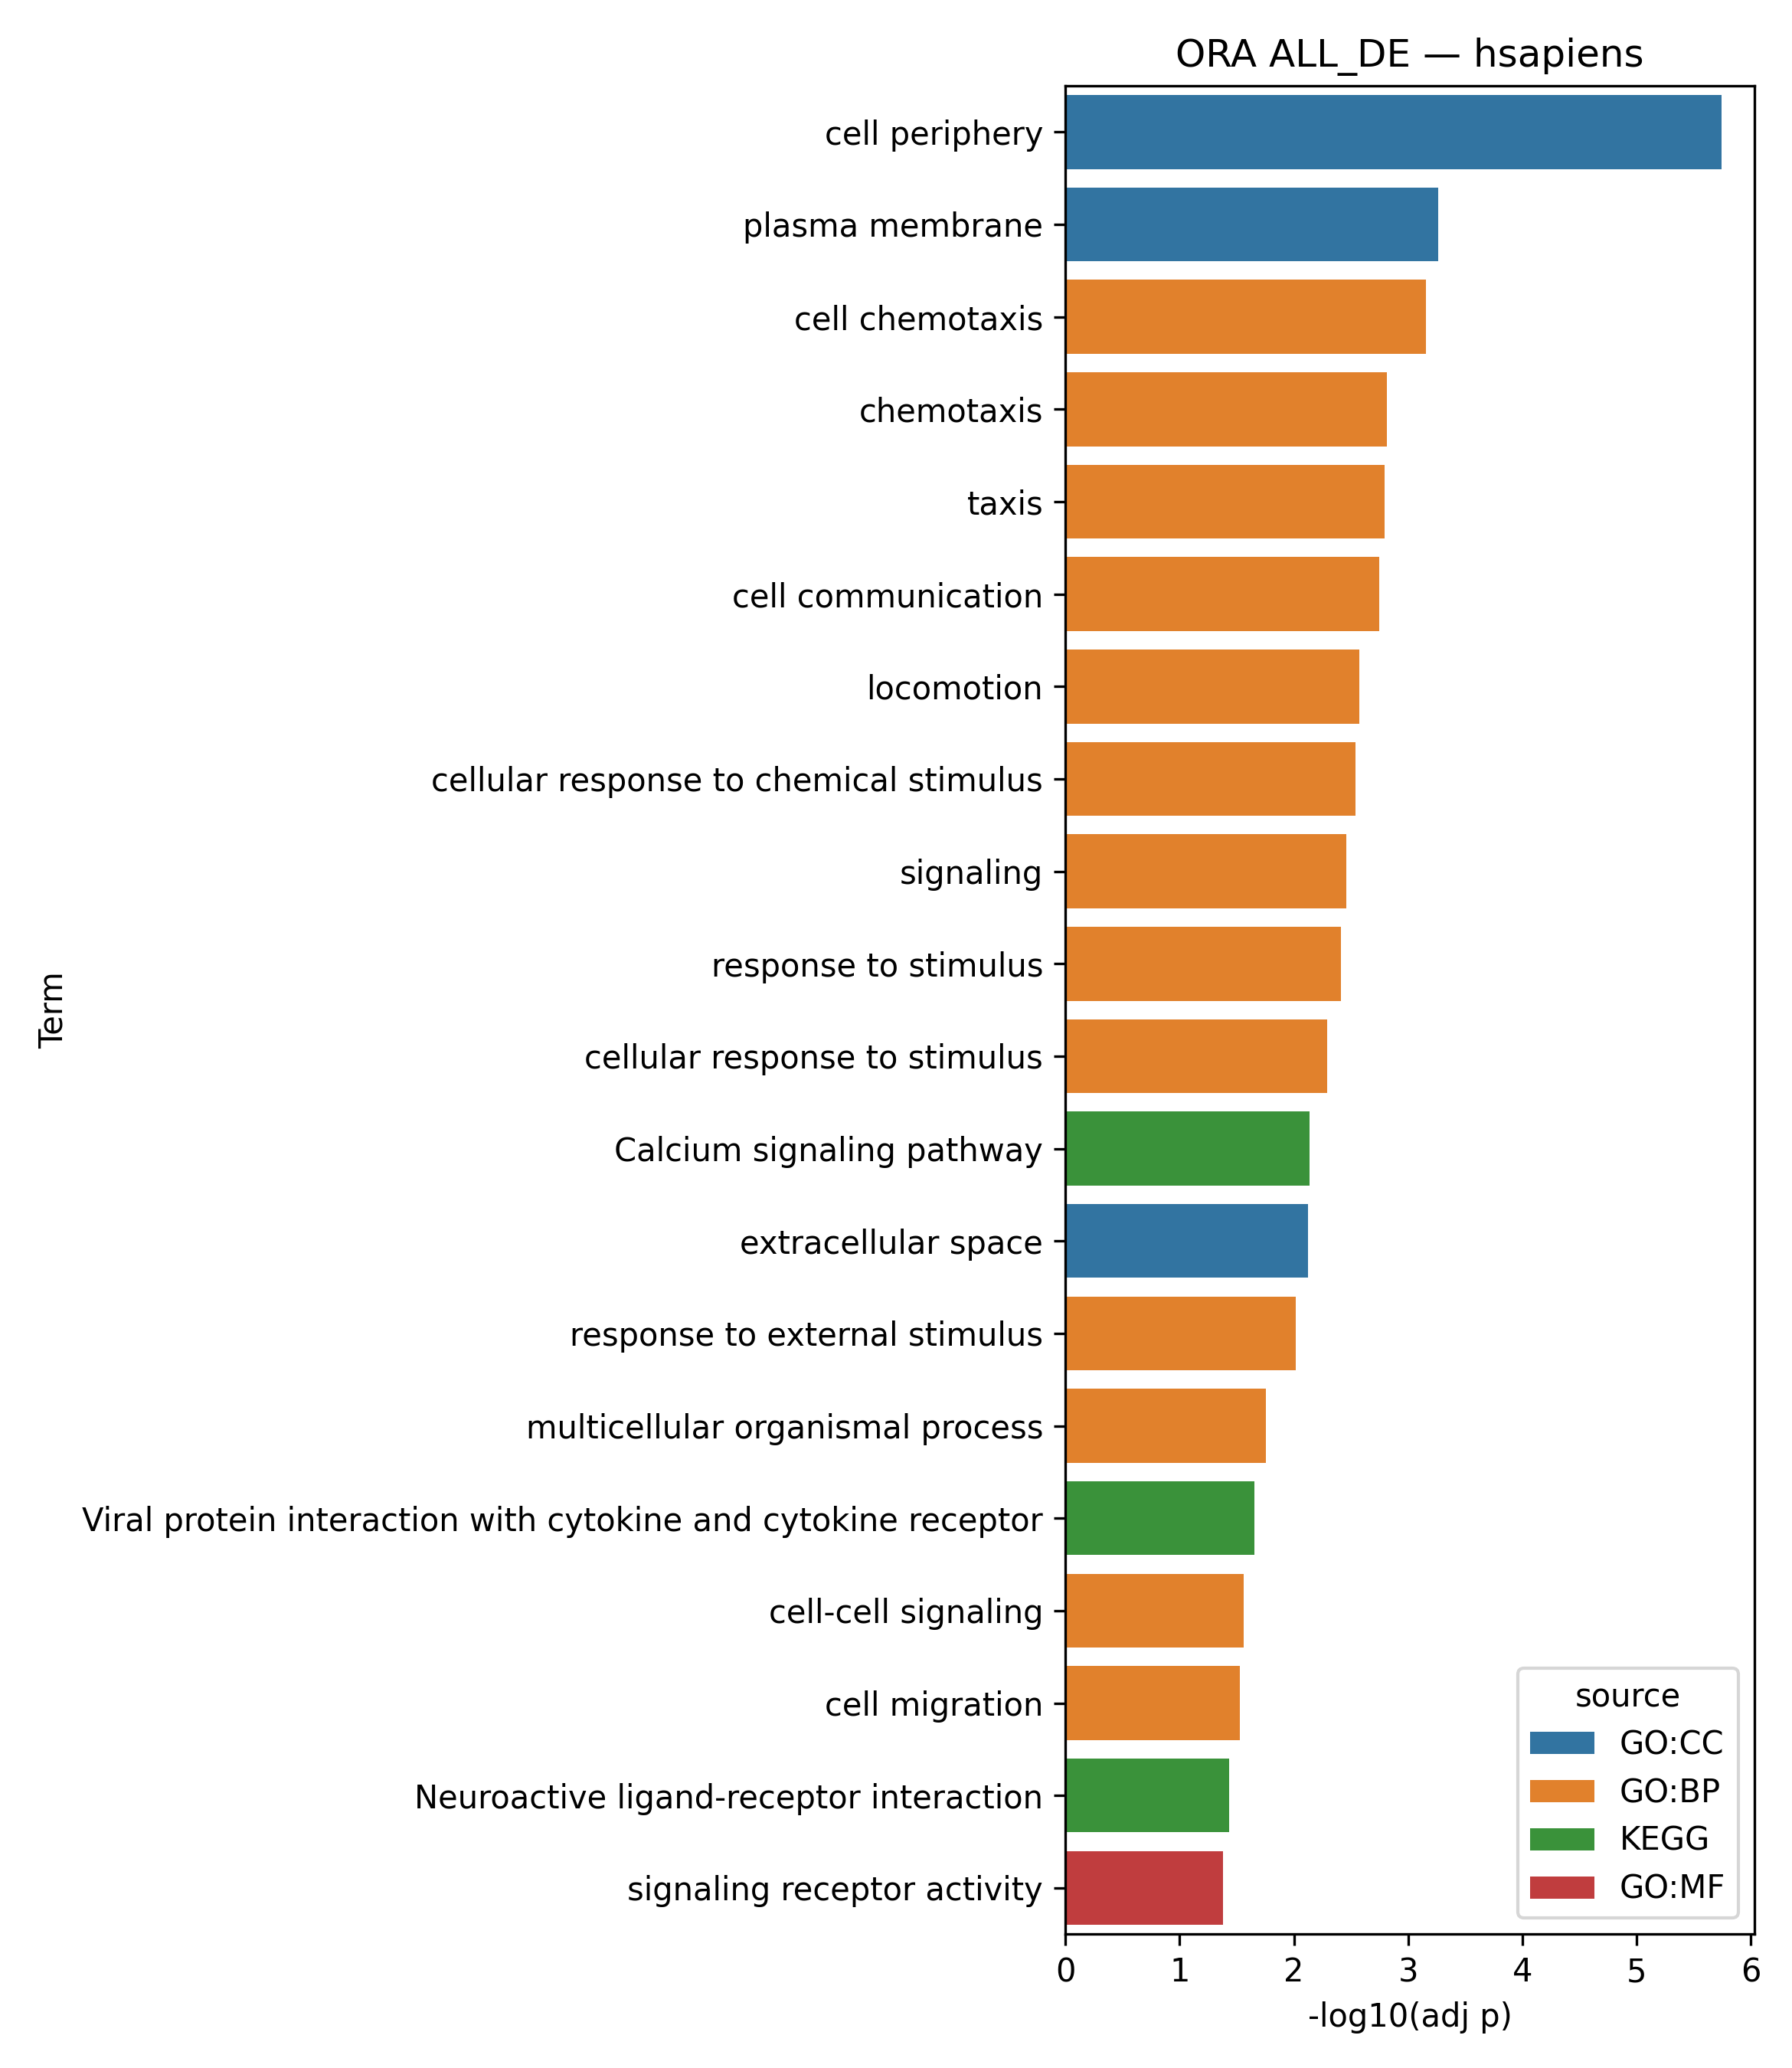
Outputs
2. Functional class scoring methods (FCS)
2.1 Gene set enrichment analysis (GSEA)
FAQ
From ORA to GSEA: why ranking-based enrichment?
Pathway enrichment methods aim to summarize gene-level results into higher-level biological interpretations. Instead of interpreting hundreds or thousands of genes one by one, they test whether genes belonging to a given pathway (gene set) show a non-random pattern in the experiment.
In Over-Representation Analysis (ORA), the input is a shortlist of genes (typically DEGs after applying thresholds such as adjusted p-value and |log2FC|). For each pathway, ORA asks whether the overlap between the pathway genes and the DEG list is greater than expected by chance (commonly using a hypergeometric or Fisher’s exact test), followed by multiple-testing correction across many pathways. Lower adjusted p-values indicate that the observed overlap is unlikely under the null model.
A key limitation of ORA is its dependence on arbitrary DEG thresholds. Genes close to the cutoffs (e.g., |FC| just below the threshold or adjusted p-value just above it) may still carry consistent biological signal, yet they are excluded from the analysis. This can noticeably change the enrichment results, especially when the number of significant DEGs is small.
To reduce this sensitivity to hard thresholds, a “second generation” of enrichment methods was introduced: Functional Class Scoring (FCS) approaches. Rather than requiring a discrete DEG list, FCS methods use all genes and test whether genes from a pathway tend to accumulate toward the top or bottom of a ranked gene list.
Gene Set Enrichment Analysis (GSEA) is the best-known FCS method. Its input is a ranked list of all genes, ordered by a ranking metric that reflects association with the phenotype (the exact metric depends on the differential expression method or study design). GSEA then evaluates whether pathway genes are enriched at the extremes of that ranked list, rather than being overrepresented in a pre-selected DEG subset.
