The monitoring page allows you to access technical information and monitor your lab. To access it, click on Settings > Monitoring.
Dashboard
The dashboard page provides you with general information about your lab and details about the installed bricks.
Lab status
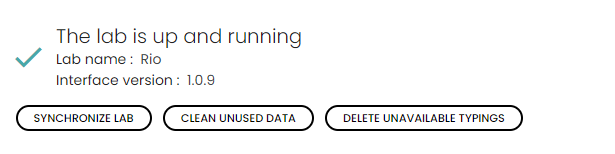
The Lab status section displays whether the lab is up and running, along with the lab name, interface version, and current disk usage.
Note: If the lab encountered errors during startup, a warning banner appears. Click on View start logs to see the error details.
From this section, you have access to the following actions:
- Synchronize lab: Opens a dialog where you can choose what to synchronize — users, folders, scenarios, and notes — based on the lab configuration in the space.
- Clean unused data: Frees up disk space by removing temporary files and resources that were not properly deleted (shadow resources).
- Delete unavailable typings: Removes process and resource types that no longer exist due to a brick update.
- System configuration: Opens the system configuration settings for your lab.
Bricks
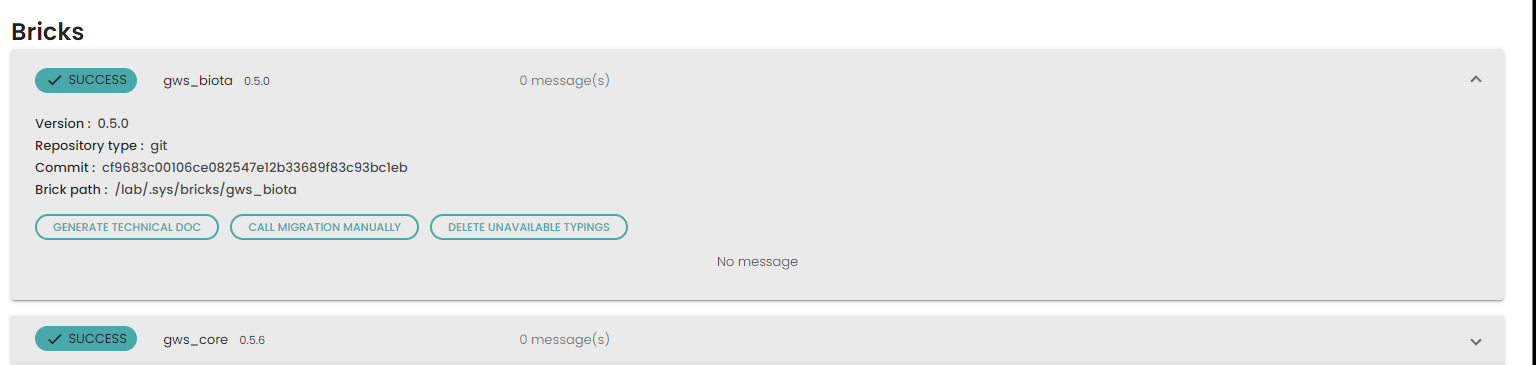
The Bricks section lists all installed bricks. You can expand each brick to see detailed information:
- Name, version, and status of the brick, along with additional details such as repository type, commit, brick path, and parent brick.
- Generate technical doc: Generates technical documentation for the brick to be uploaded to the community.
- Call migration manually: Manually triggers a brick migration to a specific version. Only use this if you understand what you are doing.
- Delete unavailable typings: Removes process and resource types from this brick that no longer exist due to a brick update.
Monitoring
The monitoring tab allows you to check resource usage of your lab. At the top, the Global section displays the current disk usage, lab disk space (used and available), number of CPU processes, total RAM, and GPU RAM (if applicable).
The Details section shows usage charts for CPU, RAM, SWAP, network, and GPU over a selected time period. You can choose a predefined period (Current day, Last hour, Last 12 hours, Last 24 hours) or select Custom to pick a specific date range. The metrics are recorded every 30 seconds.
Virtual environments
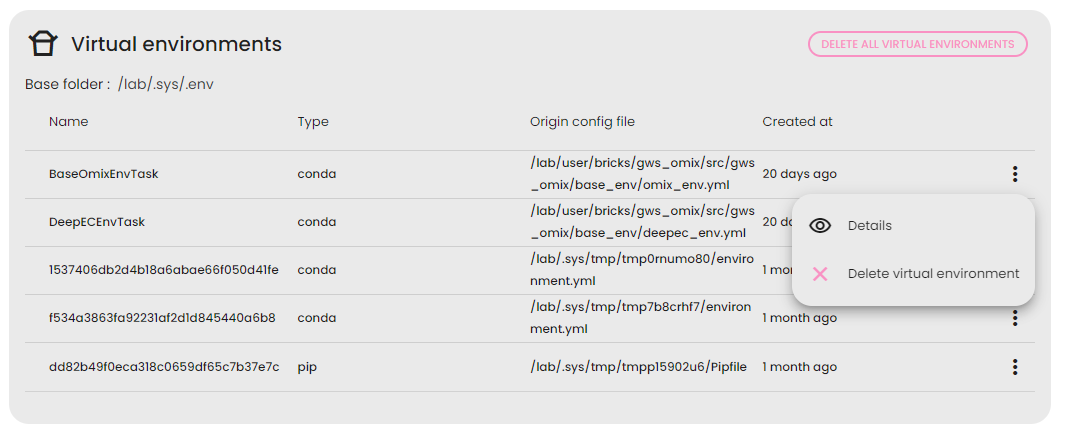
The virtual environments page allows you to manage the installed virtual environments in the lab.
For each environment, you can:
- View detailed information about the environment, such as its location on the server, size, and the configuration file used to generate it.
- Delete the environment to free up space or because there was an issue during environment installation. Deleting a virtual environment is safe, as it can be reinstalled if necessary.
You also have the option to delete all virtual environments to free up space. The virtual environments will be reinstalled when needed, but this process may take a few minutes depending on the specific environment.
Logs
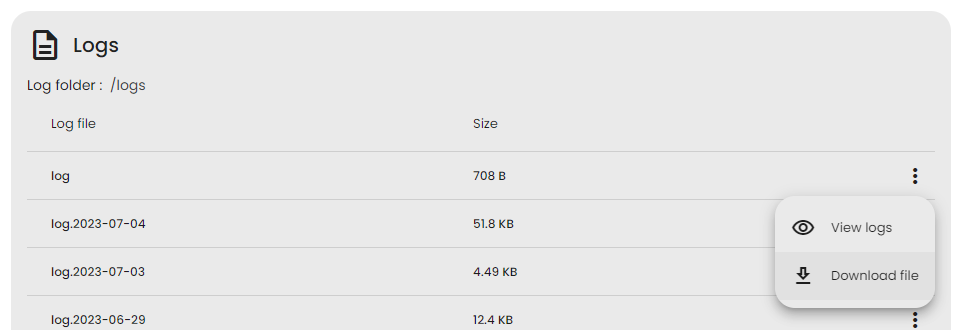
The logs page provides access to the server logs of the lab. A new log file is created for each day.
For each log file, you have the following options:
- View logs: Open the logs directly in the browser. However, it is not recommended for log files larger than 1MB.
- Download file: Download the log file to your computer for further investigation or analysis.
Credentials
The credentials page allows you to view and manage credentials stored in your lab. This is a secure location for storing credentials required by the lab for external communication. Some tasks, such as the Send resource to S3 bucket, require credentials as part of their configuration. When using credentials in a task, only the name of the credentials is stored, ensuring safety when sharing.
To create credentials, follow these steps:
- Click on the Create credentials button.
- Provide a unique name for your credentials.
- Set the type of credentials.
- Optionally provide a description.
- Fill in the credentials data based on the selected type. If you choose the Other type, you need to provide key/value pairs for the credentials. The key allows the task to retrieve the correct information when accessing the credentials.
- Click on Save to create the credentials.
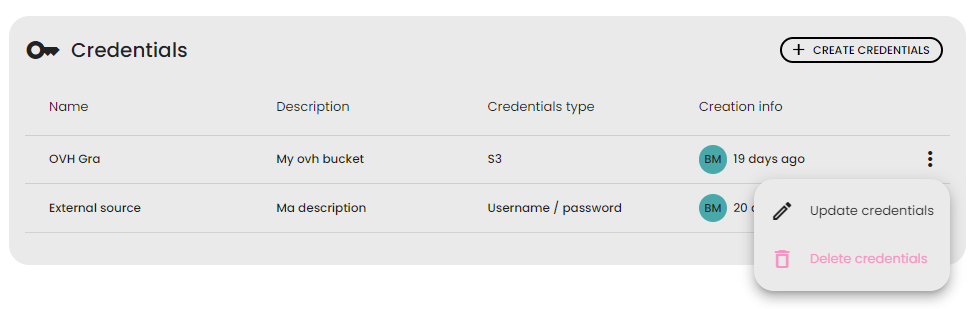
For each set of credentials, you can:
- Update credentials: This requires you to enter your username/password again. It allows you to view and modify the credentials data.
- Delete credentials: This action permanently deletes the credentials. If any tasks were using those credentials, they will no longer function.
Activities
The activities section allows you to monitor user activities in the lab. Various actions are logged, including login events, experiment creation, execution, and deletion, report creation and deletion, object validation, and archiving, among others.
You can utilize the search functionality to filter and narrow down the displayed activities based on your specific requirements or areas of interest. This enables you to efficiently track and review user actions within the lab environment.
Other
The Other tab groups additional monitoring features: share links, bricks data, and apps.
Share links
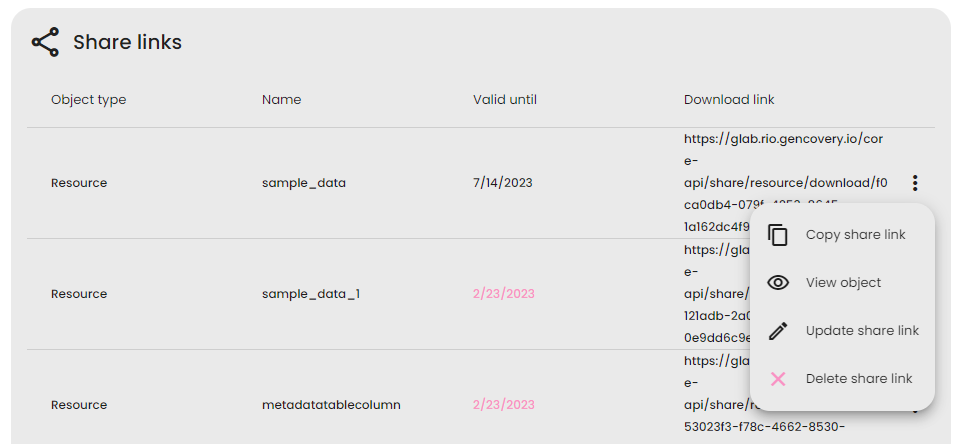
The share links section allows you to monitor all the existing share links of your lab. It displays the share links for various lab objects. From this section, you can directly manage the share links by updating their validity or deleting them as needed.
Click on Clean share links to open a dialog where you can choose to delete expired share links and/or invalid share links (links where the shared object was deleted).
Bricks data
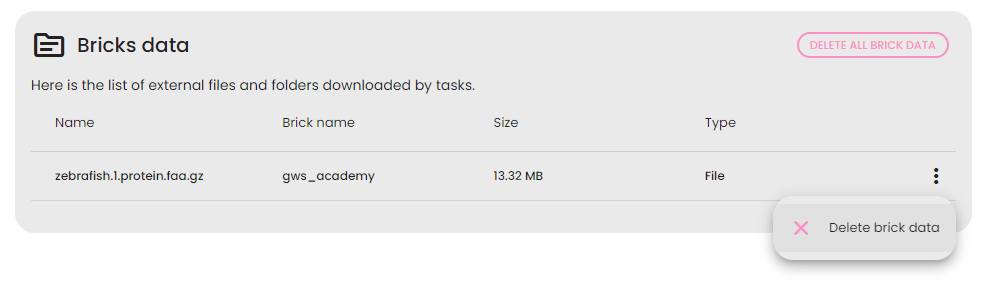
The bricks data section displays a list of files that were downloaded by tasks. A task may download an external file if it requires it to run, such as a database needed for analysis.
From this section, you can view and delete individual brick data entries. You can also click on Delete all brick data to remove all downloaded files at once, freeing up space on the server.
Apps
The apps section displays the status of running applications in your lab. For each app, you can see:
- The app status (Running, Stopped, or Starting), the user who started it, and the number of active browser connections.
- The app type, configuration path, input resources, and environment details.
- View app: Open the app in a new page.
- View logs: View the app logs for a selected time period.
- Stop app: Stop an individual app. The app will automatically restart when requested.
At the top of the section, you can click on Stop all app to stop all running applications at once. The Nginx dropdown provides options to download the Nginx configuration, access log, and error log.
