What is a resource?
A resource is any data object you work with inside a data lab. Processes in scenarios use resources as inputs and produce new resources as outputs. You can also upload resources into your data lab or import them from another lab.
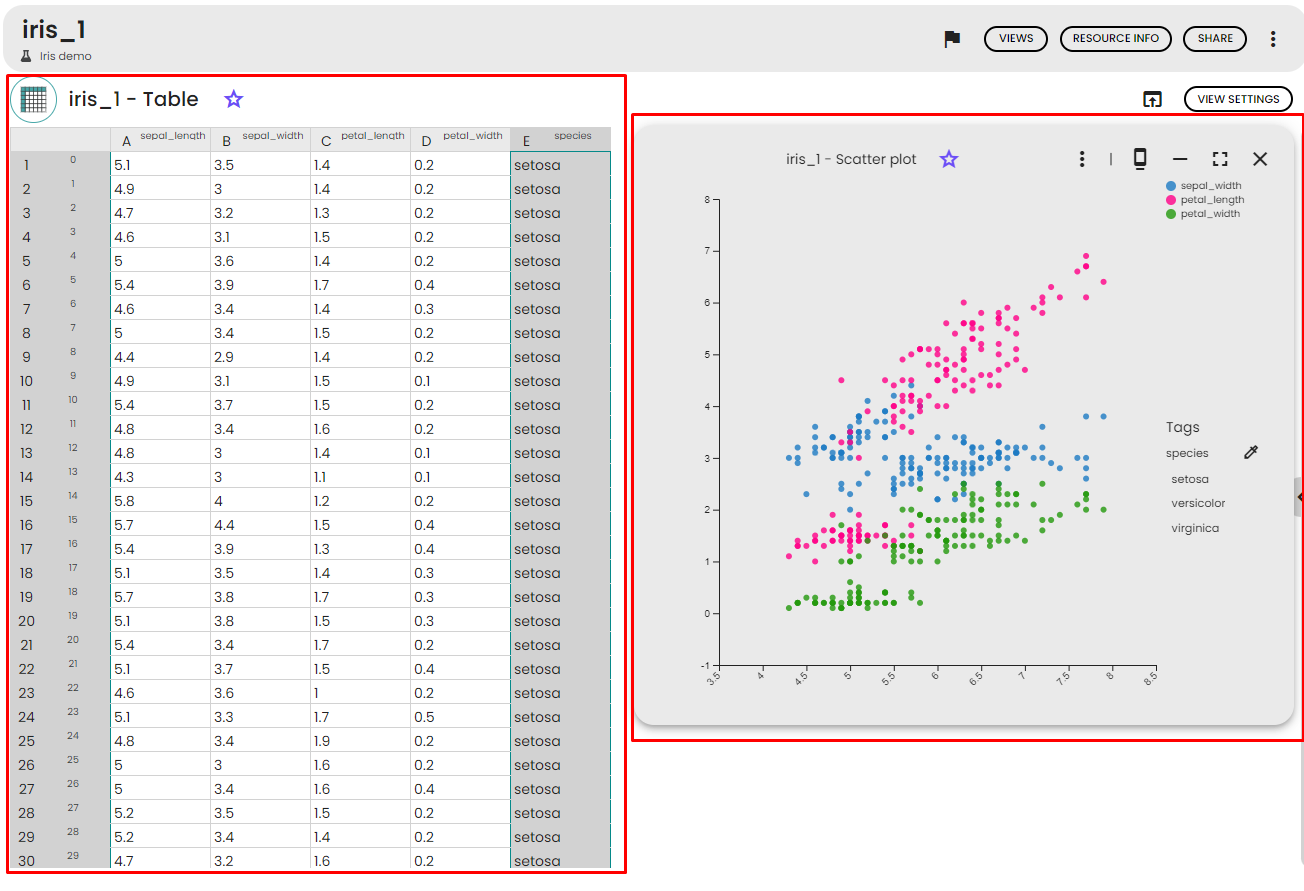
Resources come in various types — files, folders, tables, images, and more. Each resource type determines what views are available to visualize the data. For example, a table resource can be displayed as a spreadsheet or as a scatter plot.
 ▶
▶Types of resources
Every resource in a data lab has a type that describes what kind of data it contains. The type is assigned when the resource is created — either automatically by a process or manually when you upload or import data.
Common resource types include:
- File — any uploaded file (CSV, JSON, PDF, etc.)
- Table — structured tabular data, similar to a spreadsheet
- Folder — a collection of files grouped together
- Dataset — a structured dataset with rows and columns
- Image, Audio, and other media types
Each type has its own icon and display name, making it easy to identify resources at a glance. The type also determines which views are available for that resource.
Resource lifecycle
A resource can enter your data lab in several ways:
- Uploaded — you manually upload a file or folder into the data lab
- Generated — a process in a scenario produces the resource as output
- Imported from lab — the resource is imported from another data lab via a share link
Once in the data lab, you can organize and manage your resources:
- Flag a resource to mark it for quick access
- Archive a resource to remove it from active use while keeping it for historical reference
- Tag a resource to categorize and organize it with custom labels
Resources generated by a validated scenario are part of a traceable data lineage, ensuring full reproducibility of your analyses.
What are views?
A view is a visual representation of the data contained in a resource. Each view is linked to a specific resource, and a single resource can have multiple views. For instance, a table resource can be viewed as a spreadsheet or as a chart. The majority of views are interactive, allowing you to zoom, filter, and customize the display.
Views can be shared with other users and added to notes to enhance data visualization. All generated views are saved and accessible from scenarios, the resource detail page, and the Views gallery. For more details on how to use views, see Resource views.
What's in this section?
This section covers everything you need to know about working with resources in your data lab:
- Resources page — how to browse, search, filter, and upload resources
- Managing resources — the action menu, the resource detail page, and how to get information about a resource
- Resource views — how to visualize resource data using views and view actions
- Sharing resources — share links, sending resources to another lab, sharing with a space folder, and exposing resources via URL
- Importing and exporting resources — how to convert files to typed resources and export resources to files
- Resources FAQ — common questions and troubleshooting
