Introduction
You have a huge Table and don't know where to start with? Use the describe Task!
The describe task allows you to quickly know the mains features of your Table for each column. It gives you descriptive statistics of your Table.
It calls the describe function of the pandas package, which will generate descriptive statistics (dispersion, shape, distribution, and central tendency of the Table).
For more information, click here.
Prerequesites
The input should be a Table. It can contain any types of data. The output will vary depending on what is provided.
Steps to follow
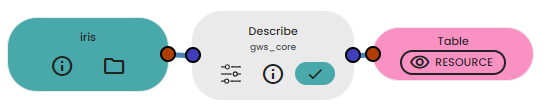
- Add your Table to your experience, if it is from a file, don't forget to convert it into a Table
- Connect your Task and chose your parameters
- Run your experience
- You are done!
Results
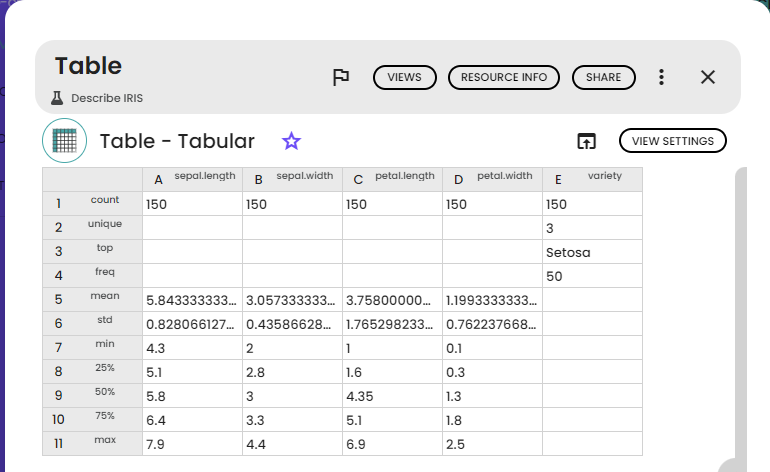
For this tutorial, the iris dataset was used. It it available in the ressources of this story. It is composed of five columns and 150 rows. The columns are : sepal.length, sepal.width, petal.length, petal.width, variety. The first four are numeric data and the last one in a tagged data.
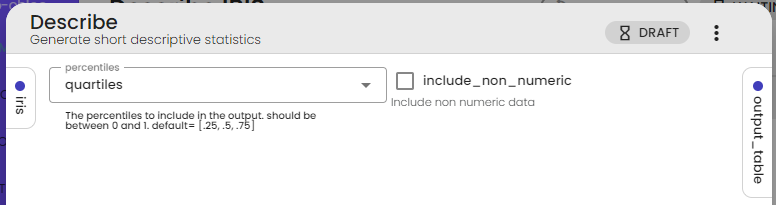
For this tutorial you should tick the box include_non_numeric and leave the percentiles on quartiles
Below you can see the output: it contains different features depending on the type of data provided. For example, numerical data such as "sepal.length" have common descriptive statistics (mean, deviation, ...), whereas non-numerical data such as "variety" have other values (unique, top, freq).

Comments (0)
Write a comment