Introduction
KEGG (Kyoto Encyclopedia of Genes and Genomes) is a valuable resource that provides detailed information on metabolic pathways, genes, proteins, diseases and many other aspects of molecular biology. KEGG data visualisation allows researchers to visually understand the complex interactions between different biological elements. Using interactive diagrams and maps, KEGG visualization provides a clear and informative perspective for exploring and interpreting biological data, making it a valuable tool for life science research.
Let show how to view genes mapped on KEGG pathways using Constellab.
In the second part of this story we will see some usefull live task to help you to manipulate the visualisation of KEGG pathway.
Task KEGG Visualisation
Prerequesites
You will need a File containing the genes to study with a header. If you have the fold change for the gene expression between two conditions for these genes, then add them in the following columns.
Steps to follow
- Upload a File with the genes and the fold change, if applicable.
- Link it to the task available in the Task
- Fill parameters
- Run your experiment
- Get your coloured KEGG pathways!


Be aware that this task can take some time, especially the first time, as a virtual environment has to be installed, and also depending on the length of the genes provided, it can take more time.
Results
In output you will get a set of pathways with the genes mapped. If you have provided the fold change, each box of the pathway will be separated depending on the number of fold changes.


If you want to have other visualisation, we provide below some useful live task.
Visualise easily a KEGG pathway in Constellab using R Live Task
The following figure shows a live task executed in a Conda environment
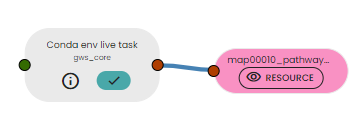
Conda environment
name: .venv
channels:
  - conda-forge
dependencies:
  - python=3.8
  - requests==2.28.2
Live code
# This is a snippet template for a Python live task.
import requests
import os
def get_kegg_pathway_id_by_name(pathway_name):
    try:
        # Make the request to search for pathway entries by name
        response = requests.get(f"http://rest.kegg.jp/find/pathway/{pathway_name}")
        if response.status_code == 200:
            # Parse the response to extract the pathway ID
            lines = response.text.strip().split("\n")
            if lines:
                pathway_entry = lines[0].split("\t")
                if len(pathway_entry) == 2:
                    pathway_id = pathway_entry[0].split(":")[1]
                    return pathway_id
        print(f"Pathway with name '{pathway_name}' not found.")
        return None
    except requests.exceptions.RequestException as e:
        print(f"Error fetching pathway data: {e}")
        return None

def download_kegg_pathway_image(pathway_id, save_path):
    try:
        # Make the request to fetch the image data
        response = requests.get(f"http://rest.kegg.jp/get/{pathway_id}/image")
        if response.status_code == 200:
            # Save the image to the specified path
            with open(save_path, "wb") as f:
                f.write(response.content)
            print(f"Pathway image saved to {save_path}")
        else:
            print(f"Error fetching pathway image. Status code: {response.status_code}")
    except requests.exceptions.RequestException as e:
        print(f"Error fetching pathway image: {e}")
if(pathway_id is None):
  pathway_id = get_kegg_pathway_id_by_name(pathway_name)
if pathway_id:
    print(f"The KEGG ID for '{pathway_name}' is: {pathway_id}")
else:
    print("Pathway not found or error occurred.")
save_path = pathway_id + "_pathway_image.png"
download_kegg_pathway_image(pathway_id, save_path)
target_paths = [save_path]
Parameters
pathway_id = None  # Replace with the pathway ID you want to explore (map00010 for example), None if not know
pathway_name ="Glycolysis"#if you don't know pathway ID, fill this with the name
Enter the id of the pathway you want to see or the name of the pathway and run the experiment: you'll get an image with the pathway entered!
Results
If you follow the previous steps you will obtain this image:
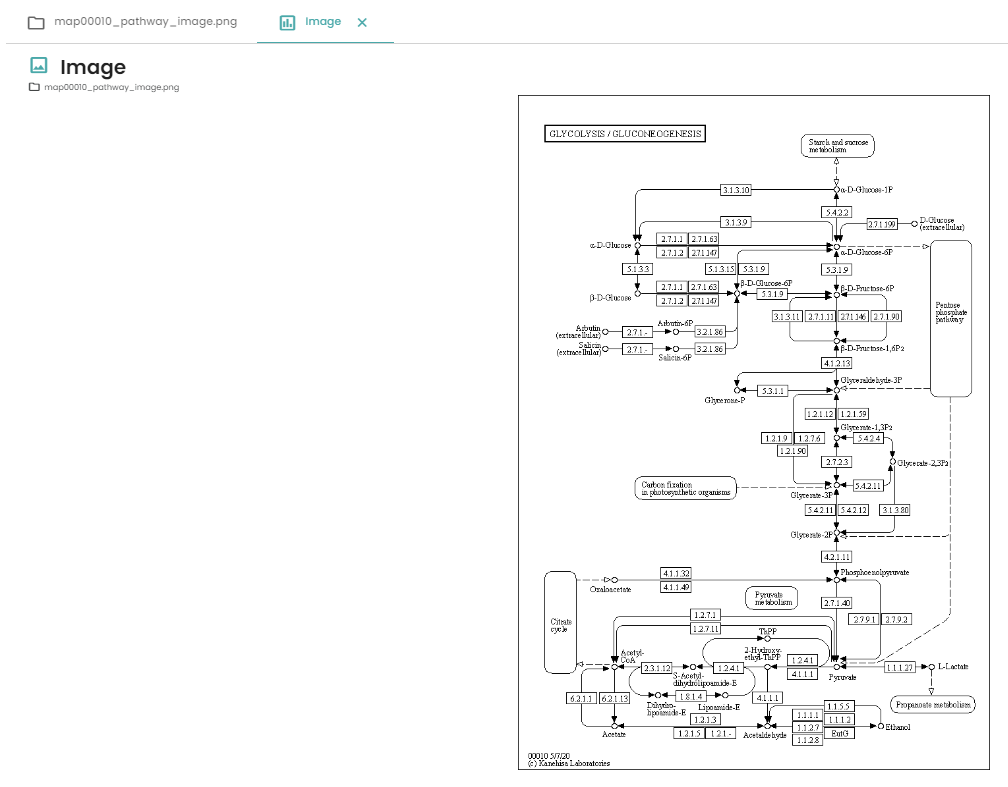
Nice, isn't it? Now you've got a dataset and you want to visualise the genes that are differentially expressed on a KEGG pathway? Let's get started!
Visualise a KEGG pathway coloured in Constellab using R Live Task
We're going to create a live task using R's pathview package.
If you want more information about the package pathview, here is the documentation.
Input
Place your dataset as input, with the columns :
- the identifier of the genes studied
- the expression value of the gene in the control condition
- the expression value of the gene in the wild type condition
Here, we will use data from this dataset. It's rat gene expression data are available for 2 conditions. If you want to reproduce this tutorial, download the "expression values across all genes" file and delete the text header and the "Gene ID" column.
Conda environment
We will use the package pathview so we need to add it. We also add 'org.Rn.eg.db' which is a genome-wide annotation for rat, so you will need to update this if you do not have rat data.
name: .venv
channels:
  - conda-forge
  - bioconda
dependencies:
  - r-base
  - bioconductor-pathview
  - bioconductor-org.Rn.eg.db
Live code
The code is as follows. It consists of calculating the log2 of the fold change of our dataset and giving the function pathview a dataframe with only these values and with gene id in the index.
# Load required packages
library(pathview)
# Read the source csv file with header, row names and comma separator
data <- read.csv(source_paths[1], header = TRUE, sep = ",")
#select data
data_pathview = data
# Compute fold_change
fold_change <- data_pathview[column_wild]/data_pathview[column_control]
# Compute log2 of the fold change
log2_fold_change <- log2(fold_change)
# Add a column to the dataframe with the value of log2(FC)
data_pathview <- cbind(data_pathview, log2_fold_change)
colnames(data_pathview)[ncol(data_pathview)] <- "log2_fold_change"
# Only keep the necessary columns
data_pathview = data_pathview[,c(column_gene_id,"log2_fold_change")]
data_pathview <- na.omit(data_pathview)
# Set the gene id as index
row.names(data_pathview) <- data_pathview[,column_gene_id]
data_pathview[,column_gene_id] <- NULL
# Use pathview function
pv.out <- pathview(gene.data = data_pathview, cpd.data = NULL, gene.idtype = type_gene_id, pathway.id = pathway_id, species = specie)
# Write the csv file and the image into the result folder
result_path <- "result.csv"
write.csv(data_pathview, file = result_path, col.names = TRUE,row.names = TRUE)
image_path <- paste0(specie,pathway_id,".pathview.png")
target_paths <- c(result_path, image_path)
Parameters
specie = "rno"
pathway_id = "00010"
type_gene_id = "symbol"
column_gene_id = "Gene_Name"
column_control = "native"
column_wild = "post_ex_vivo_lung_perfusion"
Indicate the species studied, then the identifier of the pathway you wish to see. Also indicate the identifier type of your genes (by default it's "entrez" for entrez gene id) and finally the names of the columns of your dataframe.
In this case, there are rat data so we put "rno", we want to see the glycolysis pathway ("00010"). Finally, genes are encoded by their symbol.
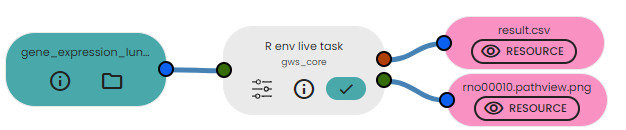
Results
With this udpated code, you can obtain a image like this:
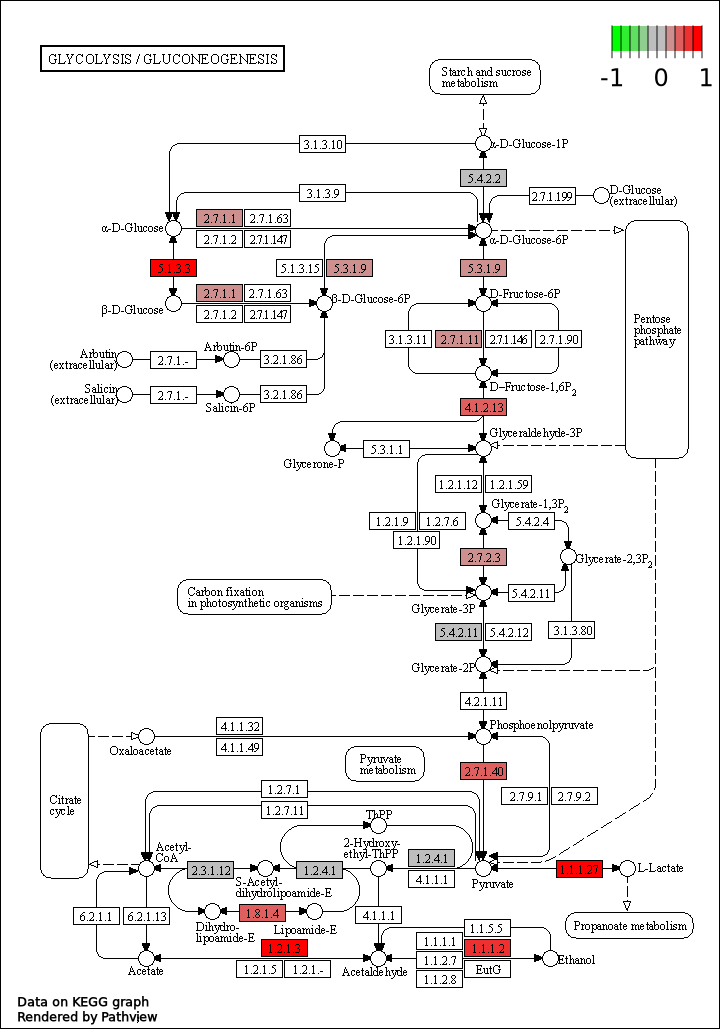
The EC numbers colored in red indicates that the log2 of the fold change between the two conditions is near 1 so the gene is over-expressed in the wild-type condition compared with the control condition.
Conversely, if it is coloured green, this means that the gene is underexpressed in the wild-type condition compared with the control condition.
Conclusion
So this tutorial has allowed you to see how to visualise the KEGG pathway in Constellab, either by using a Task either by using the Live Rask to make your own pipeline. These visualisations will certainly help you to analyse your results after a differential gene expression analysis, for example.

Comments (0)
Write a comment