Introduction
Streamlit is a widely-used Python package that enables rapid development of data applications. It is renowned for its simplicity and efficiency, making it an ideal tool for creating interactive dashboards and visualizations.
In this use case, we aim to showcase how Constellab can simplify the process of creating a Streamlit dashboard. With Constellab, you can seamlessly integrate any online tutorial or easily code your own dashboard using your data. This flexibility allows you to quickly develop custom solutions tailored to your specific needs.
Drawing inspiration from a code published on GitHub, we will demonstrate the creation of a Streamlit application designed to analyze DNA sequences. The app will count and visualize the occurrences of nucleotide sequences, providing an intuitive interface for exploring genomic data.
Steps to follow
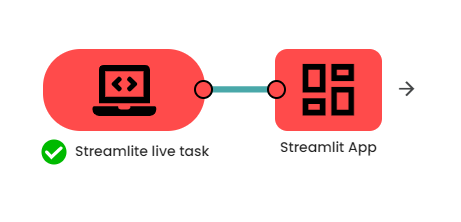
- Add a process Streamlit live task in your experiment
- Copy and paste the following code into your task
- Run your experiment and get the Streamlit App!
- Now you can change the input order directly in the Streamlit app and get personalised results!
#############################################
## Import Libraries ##
#############################################
import pandas as pd
import streamlit as st
import altair as alt
from PIL import Image
#############################################
## Page Title ##
#############################################
st.write("""
# DNA Nucleotide Count Web App
This app counts the nucleotide composition of query DNA!
***
""")
#############################################
## Input Text Box##
#############################################
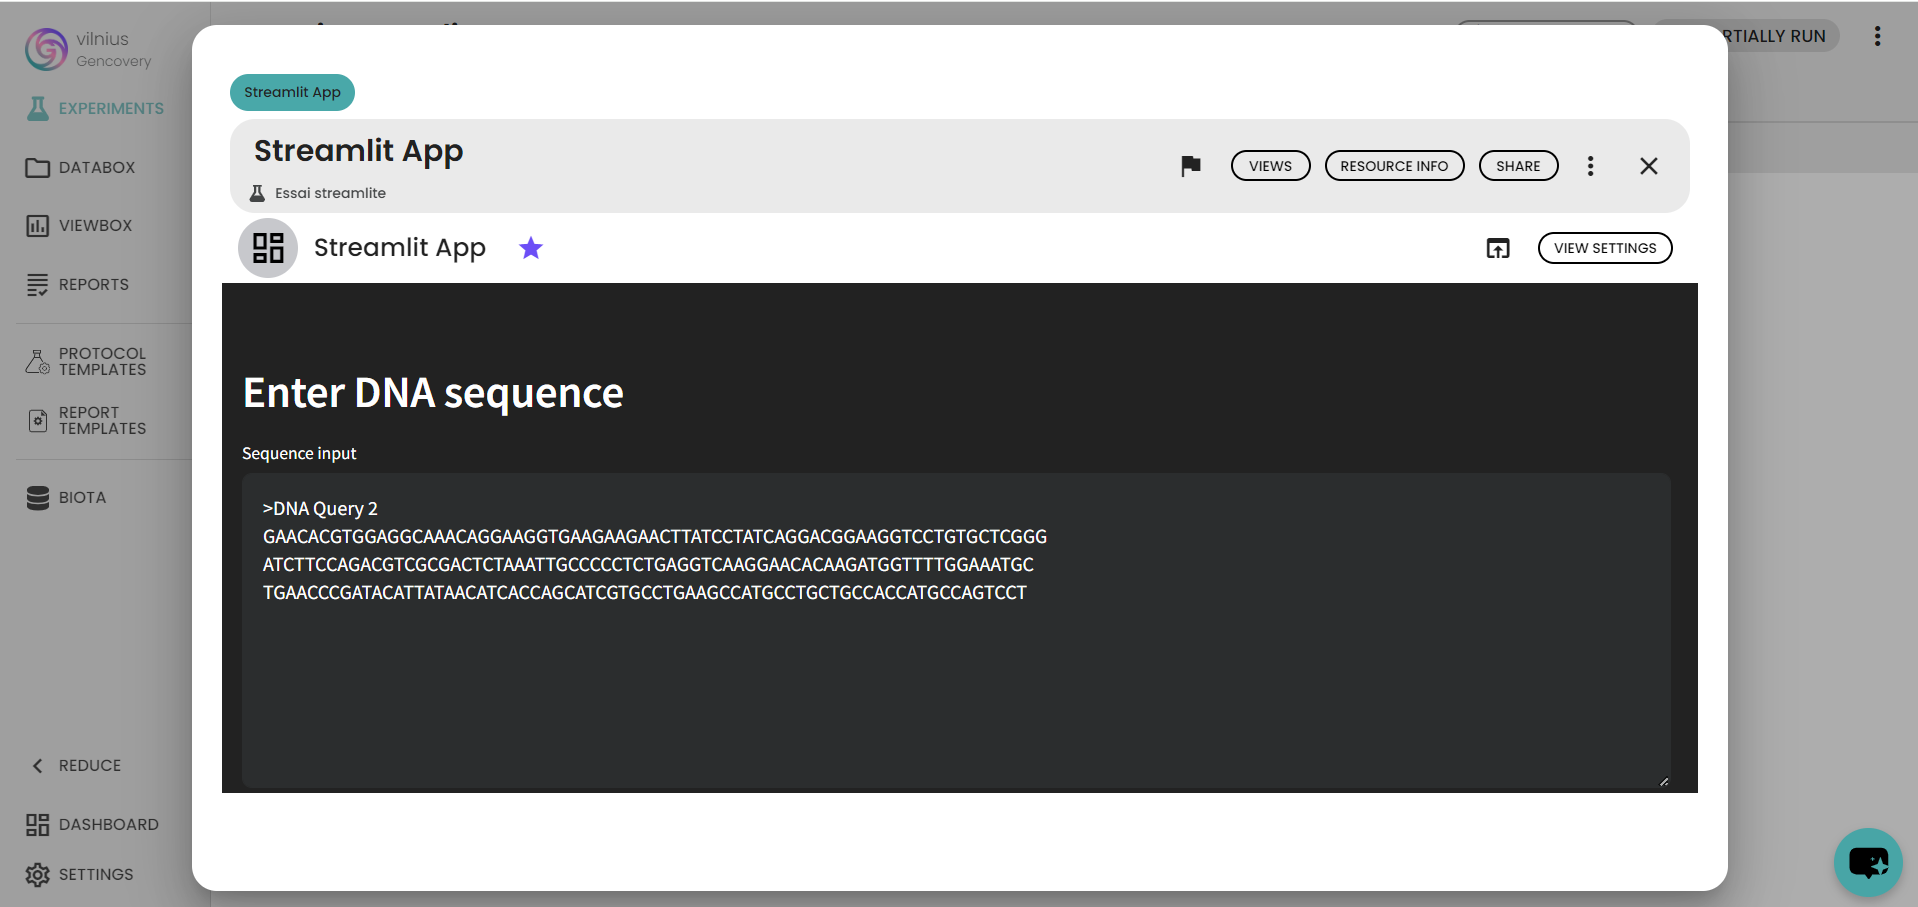
st.header('Enter DNA sequence')
sequence_input = ">DNA Query 2\nGAACACGTGGAGGCAAACAGGAAGGTGAAGAAGAACTTATCCTATCAGGACGGAAGGTCCTGTGCTCGGG\nATCTTCCAGACGTCGCGACTCTAAATTGCCCCCTCTGAGGTCAAGGAACACAAGATGGTTTTGGAAATGC\nTGAACCCGATACATTATAACATCACCAGCATCGTGCCTGAAGCCATGCCTGCTGCCACCATGCCAGTCCT"
sequence = st.text_area("Sequence input",sequence_input,height = 250)
sequence = sequence.splitlines()
sequence = sequence[1:]
sequence = ''.join(sequence)
st.write("""
***
""")
# Prints the input DNA sequence
st.header('INPUT (DNA Query)')
st.write(sequence)
#
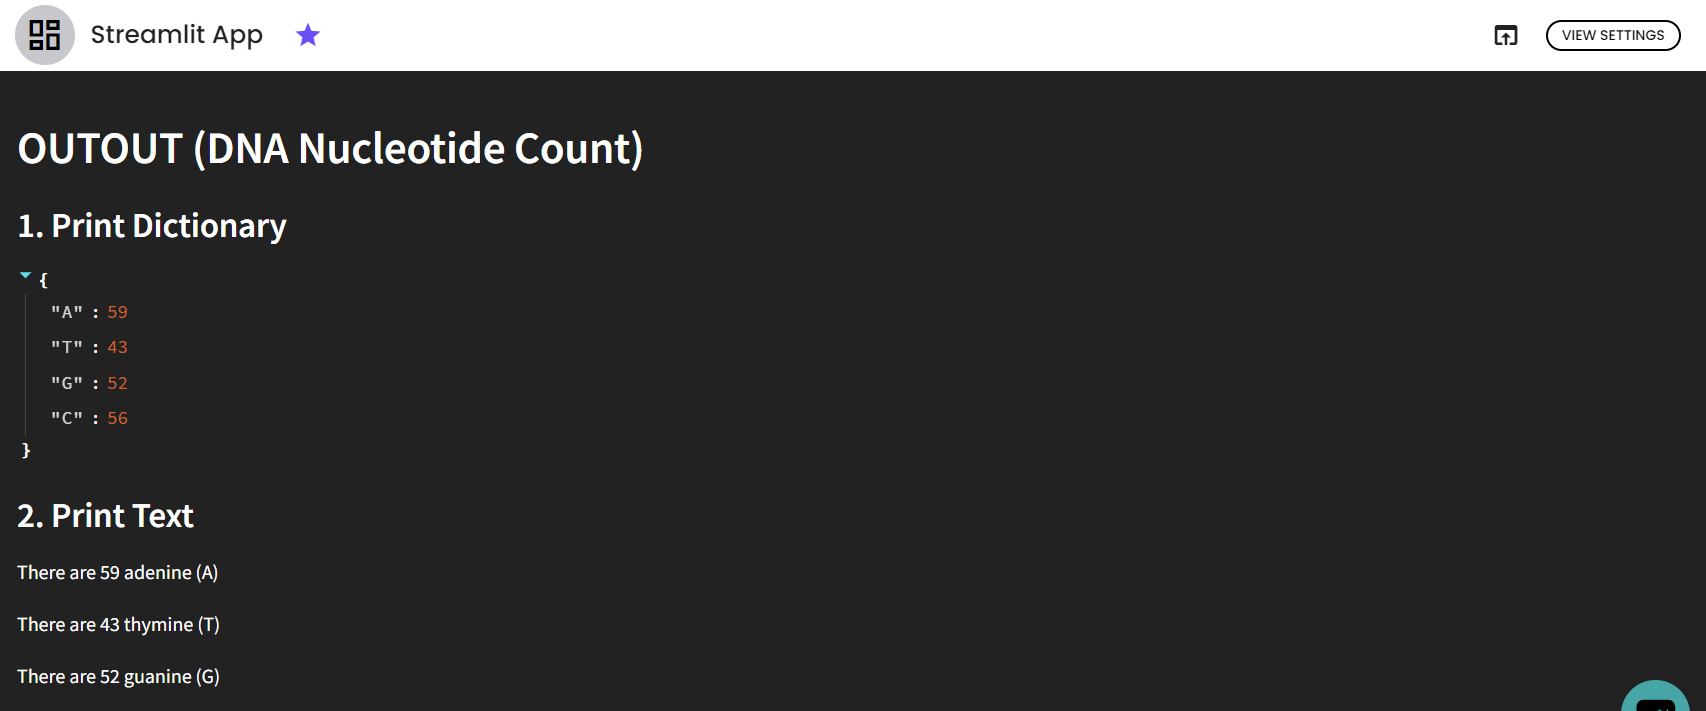
st.header('OUTOUT (DNA Nucleotide Count)')
# 1. Print Dictionary
st.subheader('1. Print Dictionary')
def DNA_Nucleotide_count(seq):
d = dict([
('A',seq.count('A')),
('T',seq.count('T')),
('G',seq.count('G')),
('C',seq.count('C'))
])
return d
X = DNA_Nucleotide_count(sequence)
st.write(X)
# 2. Print text
st.subheader('2. Print Text')
st.write('There are ' + str(X['A']) + ' adenine (A)')
st.write('There are ' + str(X['T']) + ' thymine (T)')
st.write('There are ' + str(X['G']) + ' guanine (G)')
st.write('There are ' + str(X['C']) + ' cytosine (C)')
# 3. Display Dataframe
st.subheader('3. Display DataFrame')
df = pd.DataFrame.from_dict(X, orient='index')
df = df.rename({0:'count'}, axis = 'columns')
df.reset_index(inplace = True)
df = df.rename(columns = {'index':'nucleotide'})
st.write(df)
# 4. Display Graph
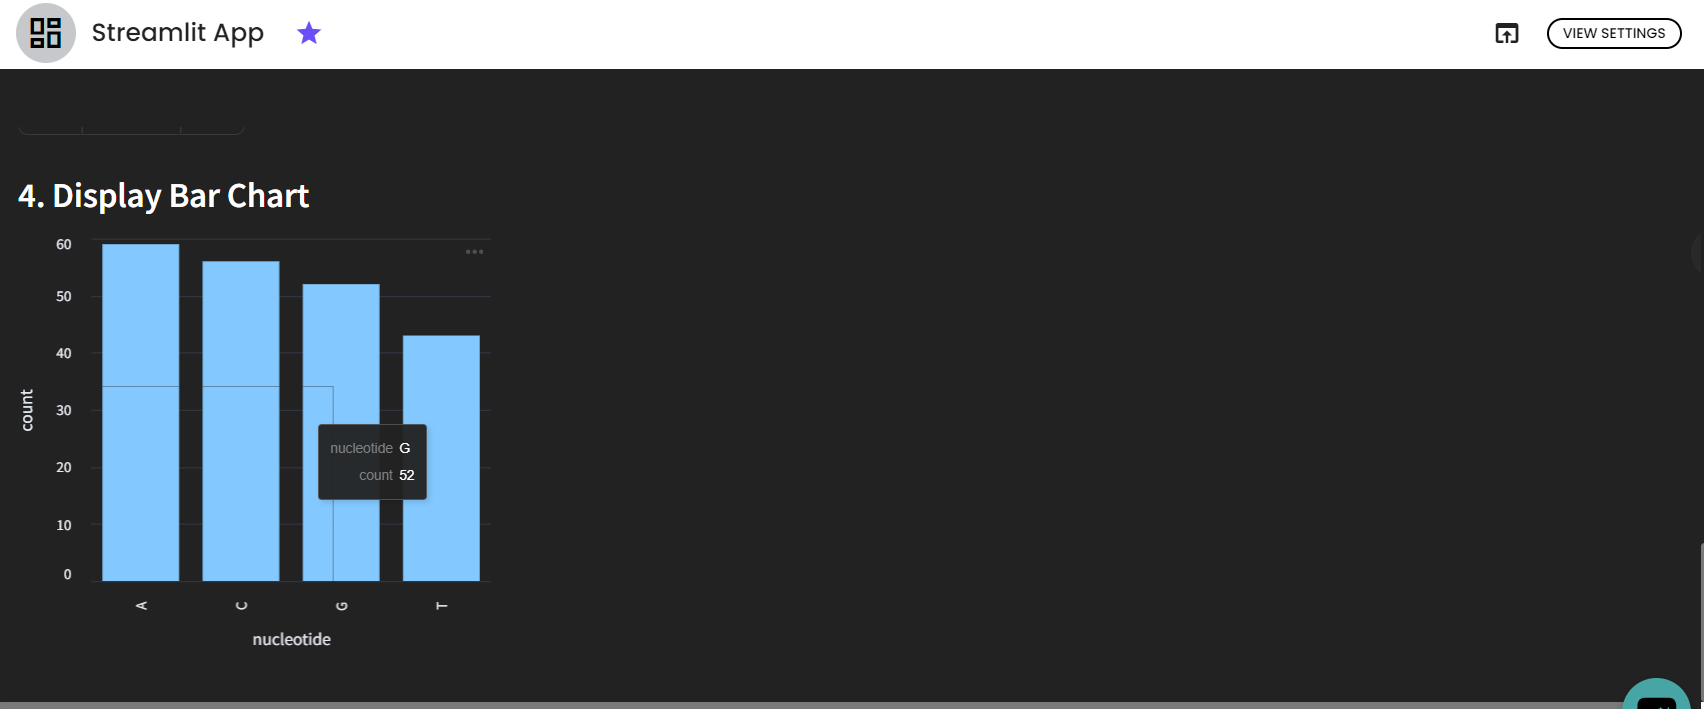
st.subheader('4. Display Bar Chart')
p = alt.Chart(df).mark_bar().encode(
x = 'nucleotide',
y = 'count'
)
p = p.properties(
width = alt.Step(80)
)
st.write(p)Results
After running the pipeline, we get a Streamlit app, which is an interactive dashboard where you can modify the DNA sequence, fly over graphs...
Conclusion
In conclusion, the pipeline outlined in this work demonstrates the creation of Streamlit apps, allowing for the seamless development of interactive dashboards. This capability facilitates efficient exploration and analysis of results, significantly enhancing your ability to derive insights and make data-driven decisions.

Comments (1)
Write a comment