If you own a BioLector XT by Beckman Coulter and are looking for a way to efficiently analyze the data it generates, you’ve come to the right place!
The BioLector XT is a cutting-edge microbioreactor designed for high-throughput bioprocess development. It tracks key parameters such as biomass, pH, and oxygen levels in real-time, making it invaluable for scalable microbial and cell culture experiments. However, extracting insights from its output can be challenging. That's where Constellab’s app comes in.
This multiplate dashboard is designed to facilitate the exploration, visualization, and analysis of data obtained from Biolector XT multiplate experiments. It provides a user-friendly interface to inspect kinetics, compare conditions, and generate insights from high-throughput cultivation systems.
How to use it?
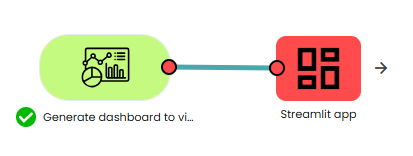
You just need to add the "Generate dashboard to visualise data from multiple experiments" task to your scenario and run it. Then open the Streamlit app.
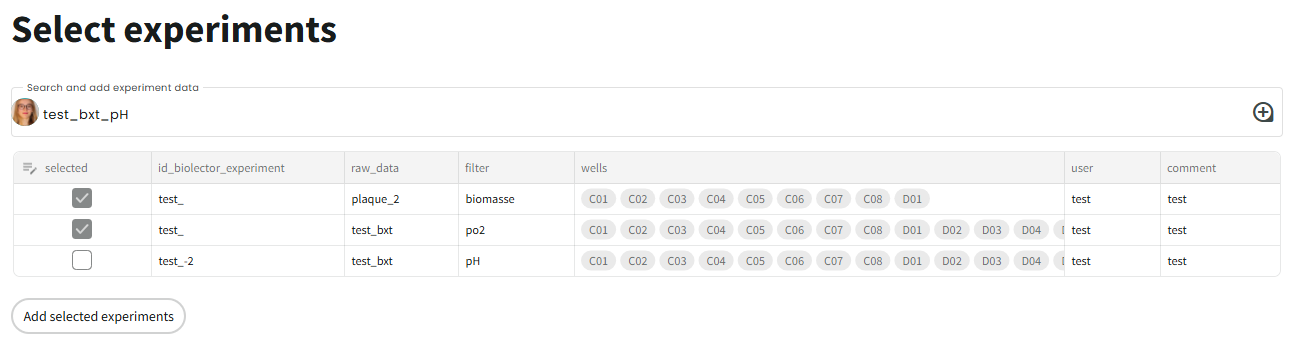
Once open, select the data you wish to analyse. To do this, you need to have generated tables using the first dashboard.
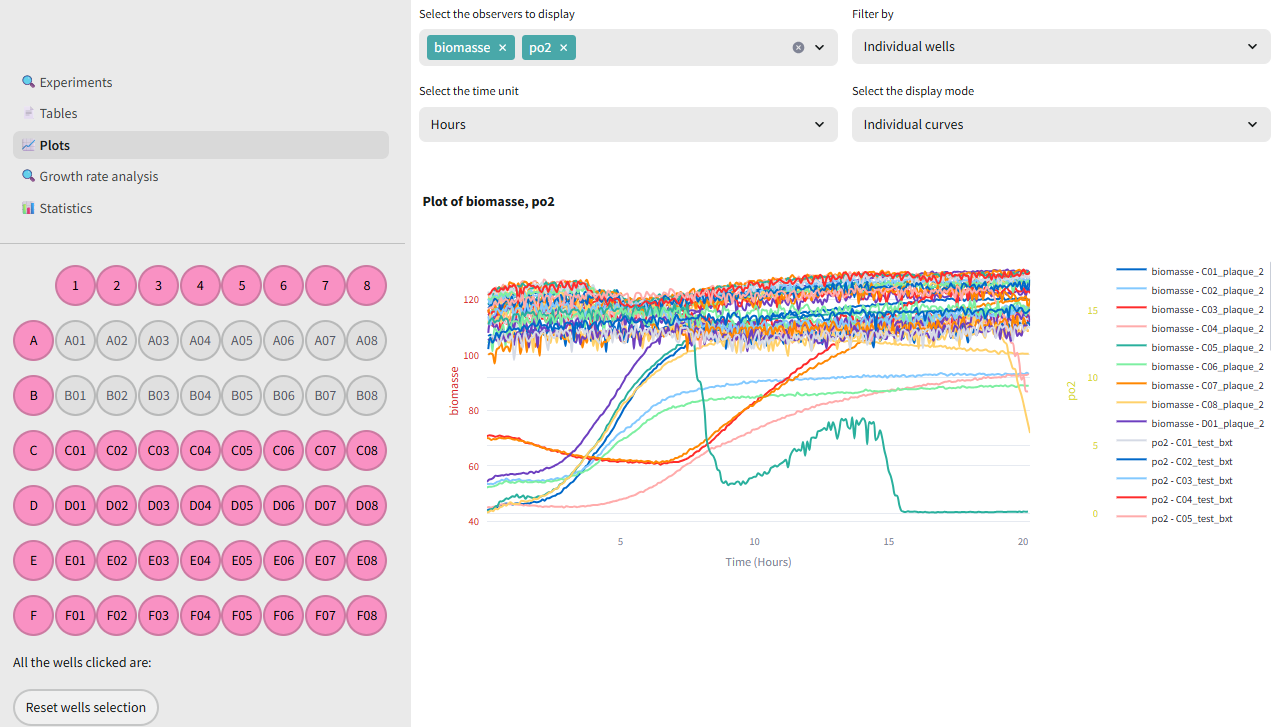
This will give you a dashboard similar to the single plate: you will have access to data tables, graphs and growth rate analysis, but this time for data obtained via different plates.
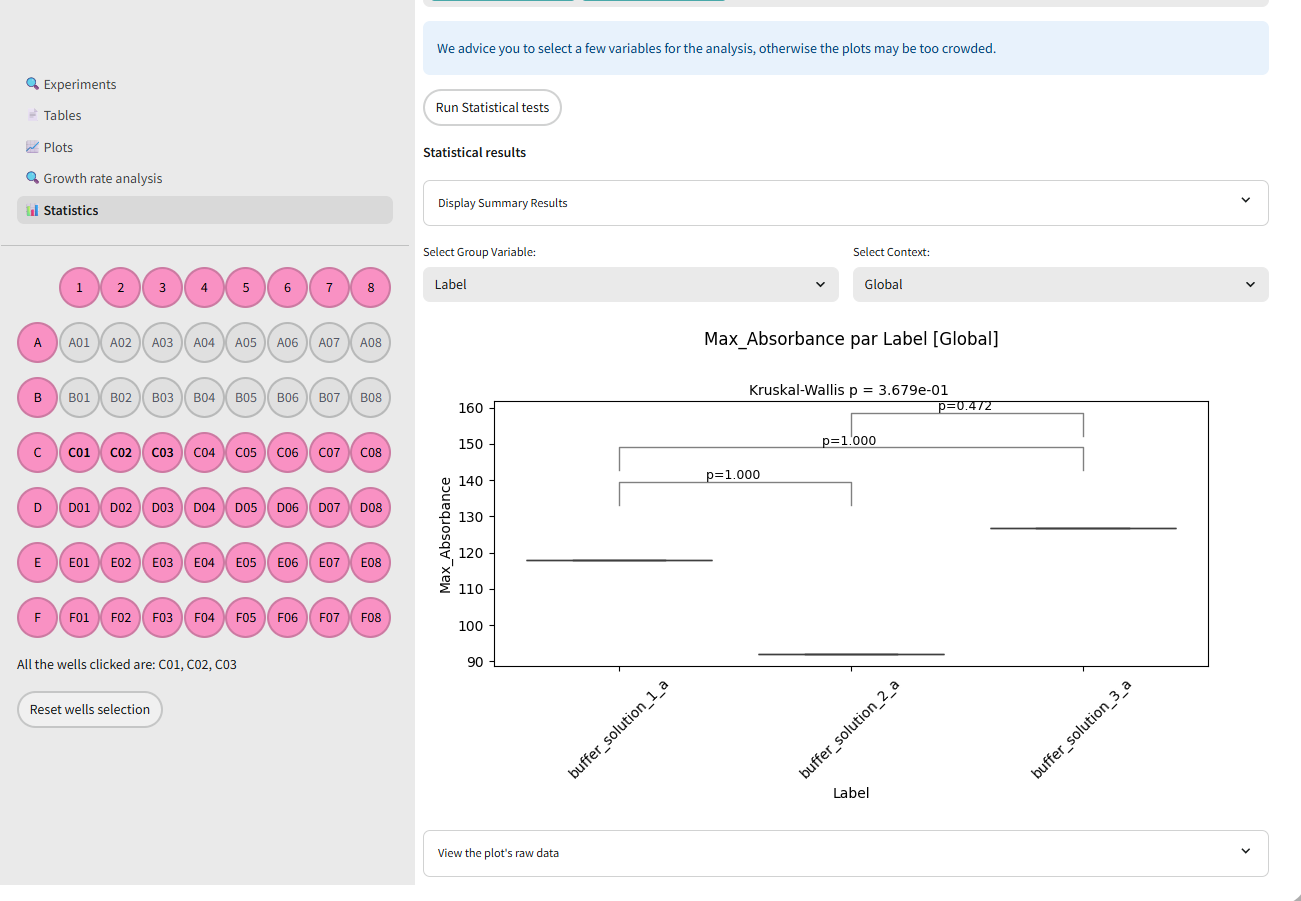
A new “statistics” page is available for performing statistical analyses on your data.
Conclusion
This dashboard streamlines the analysis of Biolector XT multiplate data by providing an intuitive interface for visual exploration, data transformation, and condition comparison. It bridges the gap between raw experimental output and actionable insights, helping researchers and process engineers make faster, data-driven decisions. With modular design and support for metadata integration, the tool is adaptable to a wide range of experimental setups. Whether used for routine screening or in-depth kinetic analysis, this dashboard accelerates your ability to interpret high-throughput cultivation results with clarity and confidence.
