🔍 Introduction
GC content is the proportion of guanine (G) and cytosine (C) nucleotides in a nucleic acid sequence. Because G–C pairs form three hydrogen bonds (vs. two for A–T/U), GC% influences duplex stability, melting temperature, PCR/primer design, codon usage patterns, and often correlates with gene-rich regions or regulatory features. Local GC% variation (rather than just the global average) can flag CpG islands—short genomic regions enriched for the CpG dinucleotide that often mark promoter regions in vertebrates.
This task computes local GC% with a 100-nt sliding window, quantifies CpG/GpC per 100 nt, predicts CpG islands, and renders an interactive HTML report where selecting a region in the GC% track highlights the matching bases in the sequence.
🧰 Prerequisites
- Access to Constellab and a valid Digital Lab environment
- Installed bricks: gws_omix ≥ 0.13.0
- Input file: FASTA or plain text nucleotide sequence (DNA or RNA)
🧪 Workflow: Step by Step
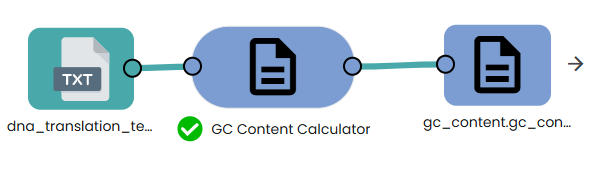
- Add the task: GC Content Calculator in Constellab.
- Provide input: Add your FASTA (dna or rna) sequence file.
- Configure:
prefix (optional): base name of the output report (default: gc_content).
- Run the task.
📤 Output
- Top plot: GC% (per 100 nt) as colored bars
Color bands:
<20, 20–29, 30–39, 40–49, 50–59, 60–69, 70–79, ≥80Hover shows window start–end and GC%
- Bottom plot: CpG and GpC per 100 ntBlack rectangles = predicted CpG islands
- Sequence panel: full sequence in monospace, grouped by 10 per chip and 100 per line, with 1-based coordinates
- Interactivity:
Drag-select a region on the top GC% plot → the corresponding chips are highlighted in the sequence panel
Example of input file
Example of output file
