Introduction
UMAPTask performs UMAP (Uniform Manifold Approximation and Projection) to reduce high-dimensional datasets into 2D or 3D representations that preserve the local and global structure of the data.
It supports optional data scaling, K-Means clustering, and interactive Plotly visualizations.
This task is ideal for:
- Visualizing complex datasets
- Detecting structure or groupings
- Pre-processing for downstream ML models
Go to the UMAP task to find out more about the parameters. You can find here the documentation of the UMAP package.
We will apply UMAP to the Iris and Digits datasets here. These are basic datasets that are used in Plotly documentation.
Examples
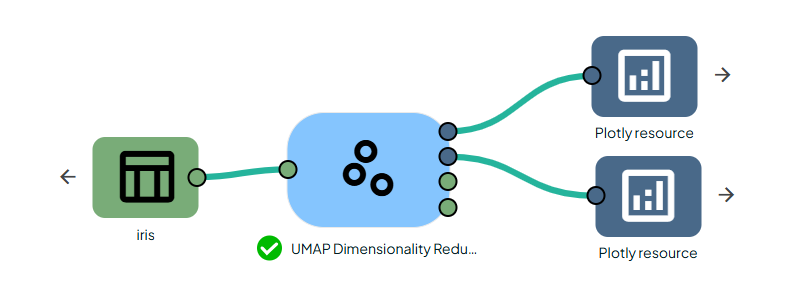
UMAP on the Iris Dataset
The Iris dataset contains 4 numeric features and 3 species. We will plot each feature and colour each point according to the corresponding species. This will enable us to test whether these feature values are species-specific.
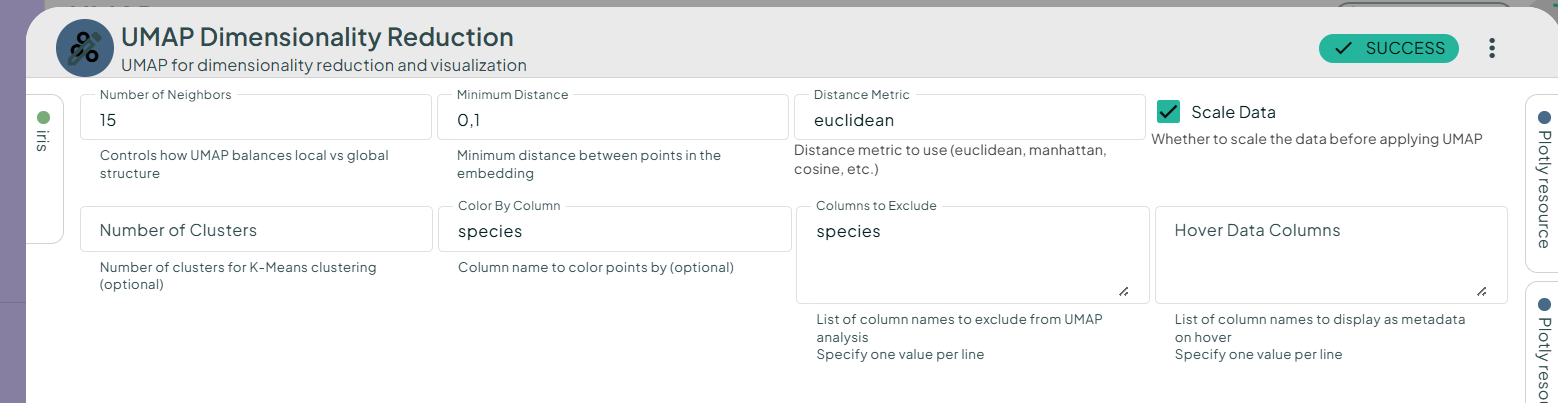
In your scenario, add the Iris dataset and the UMAP Dimensionality Reduction task. Fill in the parameters (see the screenshot below) and run the task. This will produce 2D and 3D plots, along with their respective tables.
We obtain the following plots:
In both 2D and 3D plots, three compact clusters corresponding to the three species of Iris can be seen.
We have reproduced Plotly's example UMAP projection.
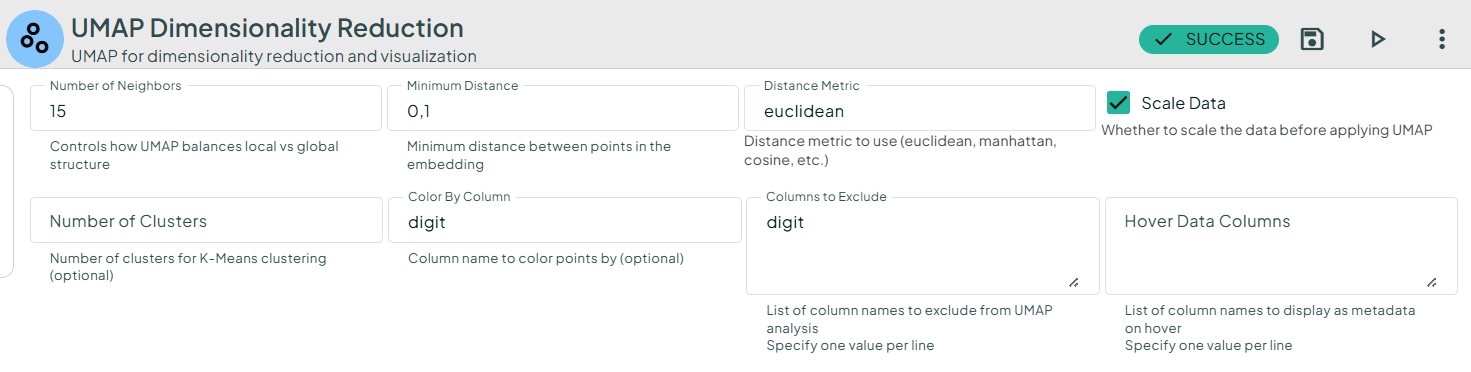
UMAP on the Digits Dataset
The Digits dataset contains 64 pixel values per image (8×8 images).
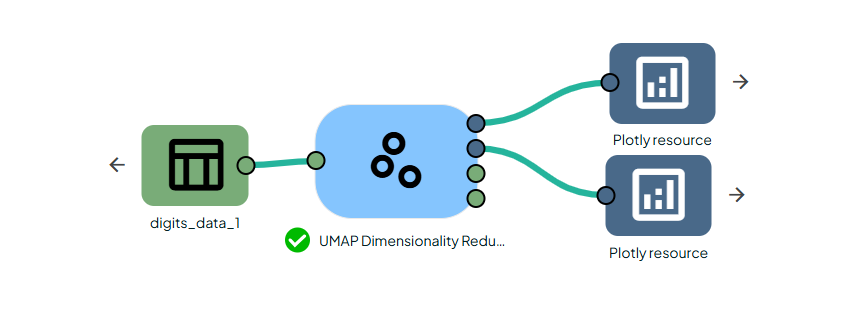
We obtain the following plots:
UMAP reveals the manifold structure that preserves digit separations.
We have reproduced Plotly's example UMAP projection.
Conclusion
UMAP Task provides a flexible and intuitive way to perform dimensionality reduction, visualize high-dimensional datasets, and uncover underlying structure in the data. With built-in options for feature scaling, clustering, and interactive Plotly visualizations, it adapts to both exploratory data analysis and production workflows. By applying UMAP to well-known datasets such as Iris and Digits, users can easily reproduce reference results from the Plotly gallery and gain confidence in the task’s behavior.
Overall, UMAPTask is a powerful component for simplifying complex feature spaces and producing rich, interpretable visual insights.
