Introduction
PLS Regression Task implements Partial Least Squares (PLS) regression, a powerful technique for modeling relationships between high-dimensional features and one or multiple continuous targets.
Unlike standard linear regression, PLS is designed for situations where:
- features are highly correlated,
- the number of predictors is large compared to the samples,
- or the dataset suffers from multicollinearity.
This task enhances the classic PLS workflow by integrating cross-validation to automatically select the optimal number of components.
It also computes VIP (Variable Importance in Projection) scores to quantify the contribution of each feature—making the model both accurate and interpretable.
Example
PLS Regression on toy data
This documentation aligns with the scikit-learn tutorial “PCR vs PLS”, allowing users to reproduce and explore a synthetic dataset for regression, component selection, and feature importance analysis.
Input data is a table containing predictor columns X0, X1 and target column y.
The toy dataset from scikit-learn’s tutorial is generated as follows:
import numpy as np
import pandas as pd
from sklearn.decomposition import PCA

rng = np.random.RandomState(0)
n_samples = 500
cov = [[3, 3], [3, 4]]
X = rng.multivariate_normal(mean=[0, 0], cov=cov, size=n_samples)

pca = PCA(n_components=2).fit(X)
y = X.dot(pca.components_[1]) + rng.normal(size=n_samples) / 2

df = pd.DataFrame(X, columns=['X0', 'X1'])
df['y'] = y
df.to_csv("pcr_vs_pls_toydata.csv", index=False)
print("Saved toy data to pcr_vs_pls_toydata.csv")
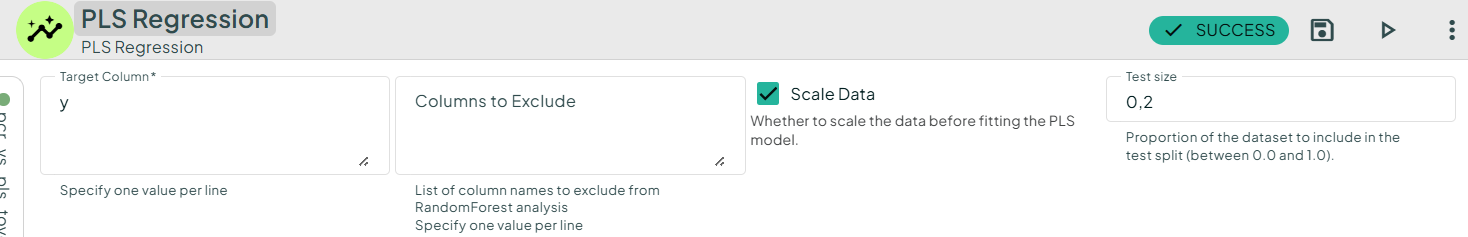
In your scenario, upload this data and connect the PLS regression task to it. Enter the parameters, including the target, and then run the scenario!
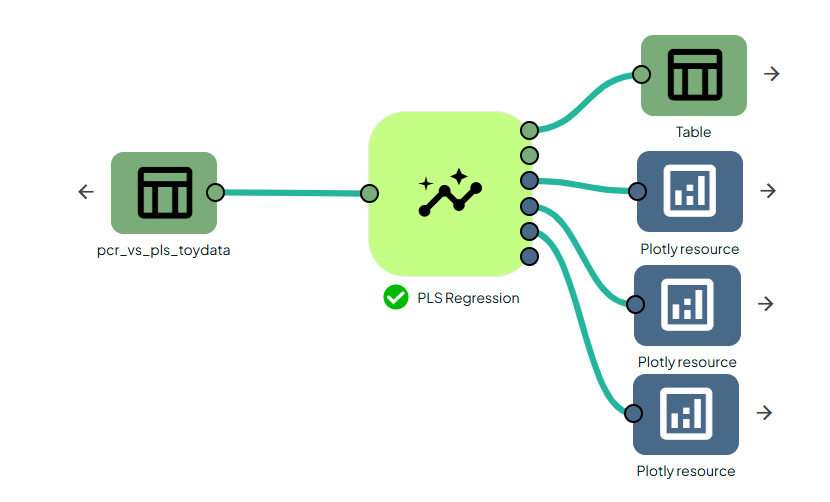
The output will provide you with different files, such as tables and plots, which will inform you whether your model is making good predictions or not.
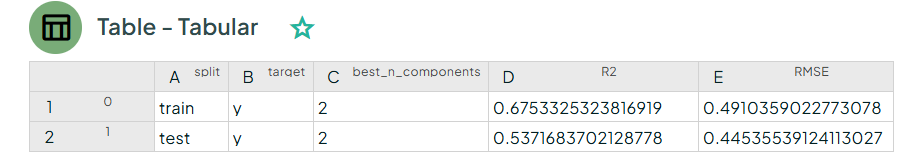
As we can see, the R² value is good for both the training and testing datasets.
Predicted vs true plots illustrate the quality of PLS regression. The behavior closely matches the scikit-learn tutorial example.
Conclusion
PLSRegressionTask provides a robust, informative, and fully automated workflow for Partial Least Squares regression.
By combining cross-validation–based component selection with VIP interpretability and rich visual diagnostics, it makes PLS accessible both to beginners exploring their first multivariate regression models, and to experts working with complex, high-dimensional datasets.
