The Ubiome Dashboard is a Streamlit application designed for microbiome data analysis and visualization. It provides an interactive interface for processing, analyzing, and interpreting 16S rRNA sequencing data through various bioinformatics workflows.
This standalone dashboard only allows users to visualise results that have already been run. However, don't hesitate to contact us to arrange a demo of the full app, in which we can also run analyses automatically!
Multi-Step Analysis Pipeline
The dashboard implements a structured analysis workflow with the following steps:
- Metadata table: Create a metadata table from a fastq folder
- Quality Control (QC): Initial data quality assessment
- MultiQC Reporting: Comprehensive quality control reporting
- Feature Inference: ASV/OTU identification and quantification
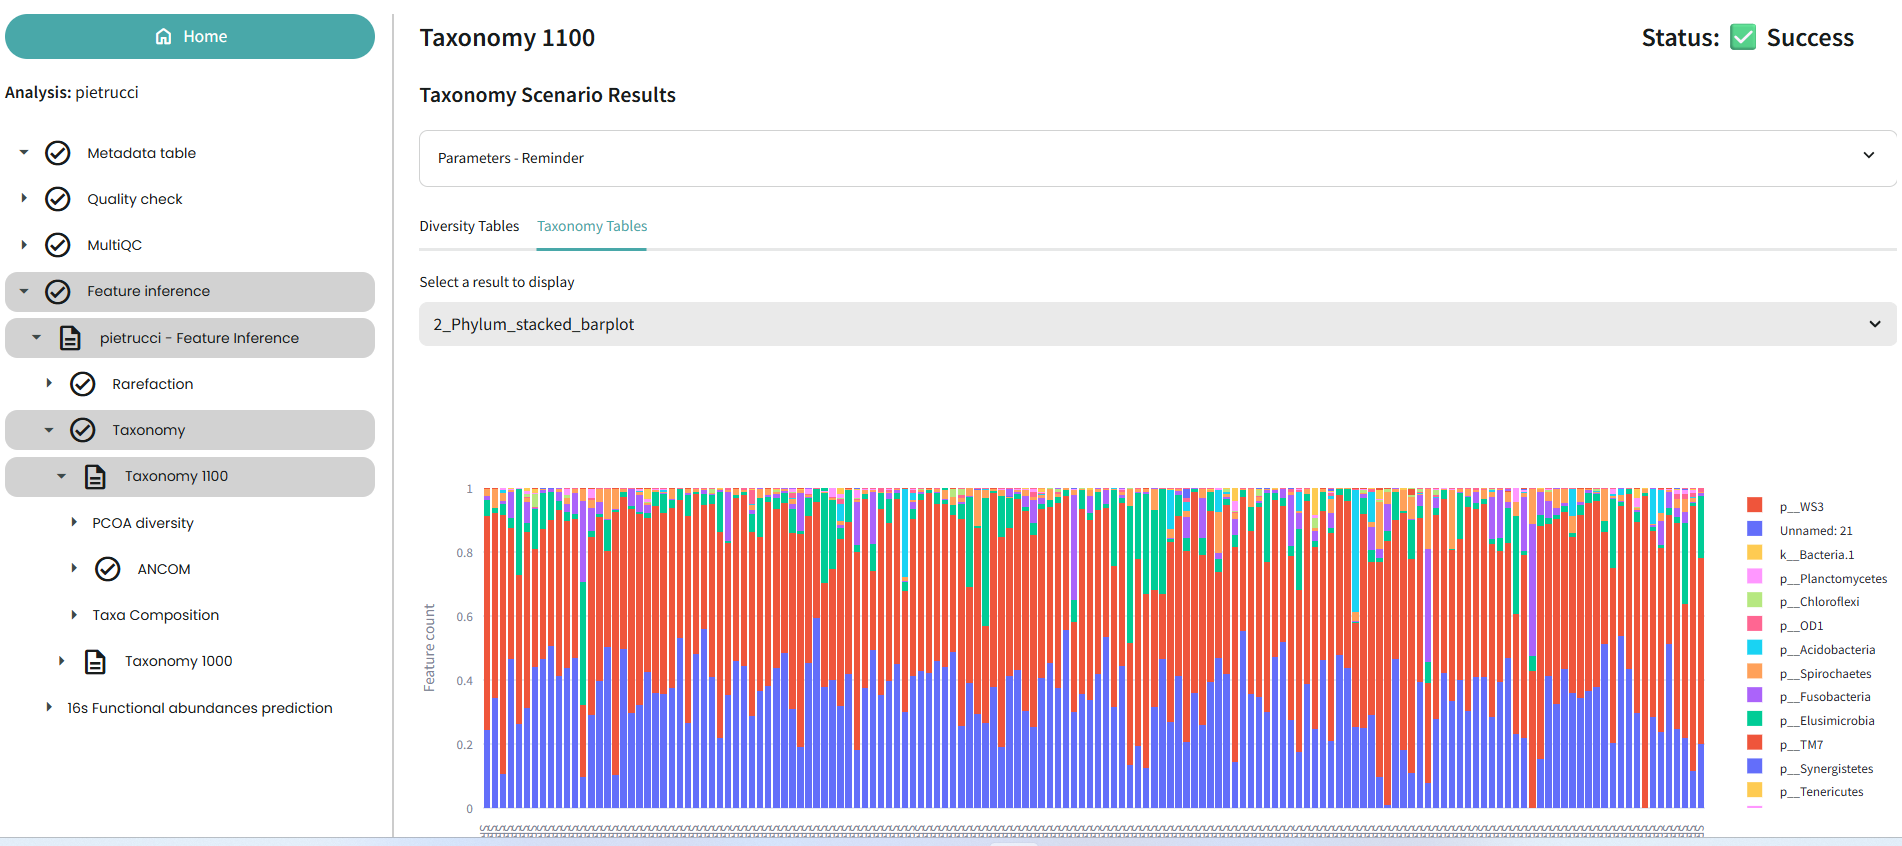
- Taxonomy Assignment: Taxonomic classification of features
- Rarefaction Analysis: Diversity curve generation
- PCoA (Principal Coordinate Analysis): Beta diversity visualization
- ANCOM (Analysis of Composition of Microbiomes): Differential abundance testing
- Database Annotation: Feature annotation against reference databases
- Functional Prediction: Metabolic pathway inference using tools like PICRUSt2
Comments - 0
Login to post a comment
Login