Introduction
First step in scRNA-seq downstream analysis is count matrices loading and pre-processing. For this aim, an open-source Python library called scanpy was used (click on this link). This library provides a user-friendly interface to load and manipulate various file types commonly used in scRNA-seq experiments, including CSV, H5, and matrix market (MTX) files. This flexibility allows researchers to seamlessly work with their preferred data formats and integrate their own datasets into the analysis.
Main functions of Scanpy :
- One crucial step in scRNA-seq analysis is the identification and elimination of potential doublet cells, which arise due to experimental artifacts. Doublet cells can lead to misleading conclusions and impact downstream analysis. Scanpy employs the SOLO method from the scvi package, a popular toolkit for single-cell variational inference, to accurately predict and flag doublet cells. By removing these erroneous cells, the script ensures the integrity and reliability of the analysis results.
- Furthermore, scanpy incorporates essential quality control (QC) metrics, including mitochondrial genes, ribosomal genes, and hemoglobin genes, to assess the overall health of the scRNA-seq data. It calculates and stores these QC metrics for each cell, allowing researchers to identify potential sources of variation and potential batch effects that might influence subsequent analysis steps.
Steps to follow
- Ensure that the version 0.1.2 of the brick gws_scomix is loaded.
- So first, upload your count matrices folder. The input file format accepted are : .h5 ; .csv ; matrix.mtx.gz, barcodes.tsv.gz, features.tsv.gz or matrix.mtx, barcodes.tsv , features.tsv.
- Then, create a new experiment.
- Import your resource
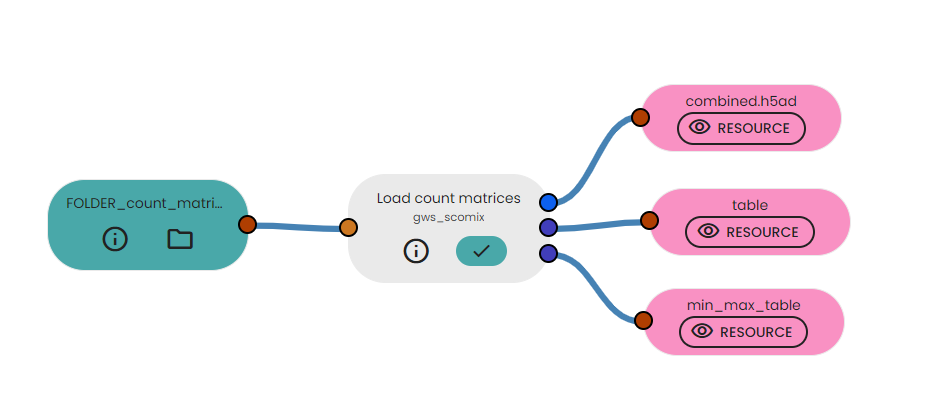
- Link it to the task "Load count matrices" available in the brick. ( PLEASE read carefully the documentation of this task in order to understand the files name formats instructions)
- Run your experiment.
Description of output files
This task will generate :
- combined.h5ad : This file contains the merged data from multiple input files, representing different samples or conditions. The combined data includes cell-level expression profiles, metadata information, and quality control metrics.
- table : This table includes information about each cell's sample ID, the number of genes detected (n_genes_by_counts), total counts, percentage of counts from mitochondrial genes (pct_counts_mt), percentage of counts from ribosomal genes (pct_counts_ribo), and percentage of counts from hemoglobin genes (pct_counts_hb).
- min_max_table : This table summarizes the minimum and maximum values of essential metrics across the entire combined dataset. The table includes metrics such as the minimum and maximum number of genes detected (n_genes_by_counts), minimum and maximum total counts, minimum and maximum percentages of counts from mitochondrial genes (pct_counts_mt), percentages of counts from ribosomal genes (pct_counts_ribo), and percentages of counts from hemoglobin genes (pct_counts_hb). Additionally, the table contains the total number of cells and genes in the combined dataset.

Comments (0)
Write a comment