Introduction
In 2019, Pietrucci et al. published a study on gut microbiota dysbiosis in Parkinson's patients, analyzing 152 fecal samples from 80 patients and 72 healthy controls. The authors conducted 16S ribosomal RNA gene amplicon sequencing combined with dietary/lifestyle data. Sequencing files are available in Sequence Read Archive (PRJNA510730). Their analysis found significantly higher levels of Lactobacillaceae, Enterobacteriaceae, and Enterococcaceae families, and reduced levels of Lachnospiraceae in PD patients compared to controls. Constellab's gws_ubiome brick offers metabarcoding analysis using Qiime2 and Picrust2. Users can upload fastq files and metadata, deploy the pipeline, adjust parameters, and access results in minutes.
Prerequesites
To proceed with 16S metabarcoding analysis on your dataset, you must ensure that the following prerequisites are met
Methods
Steps to follow
In this section, we'll outline the various steps to follow in order to conduct 16S metabarcoding analysis in Constellab
1. Upload data into Constellab databox
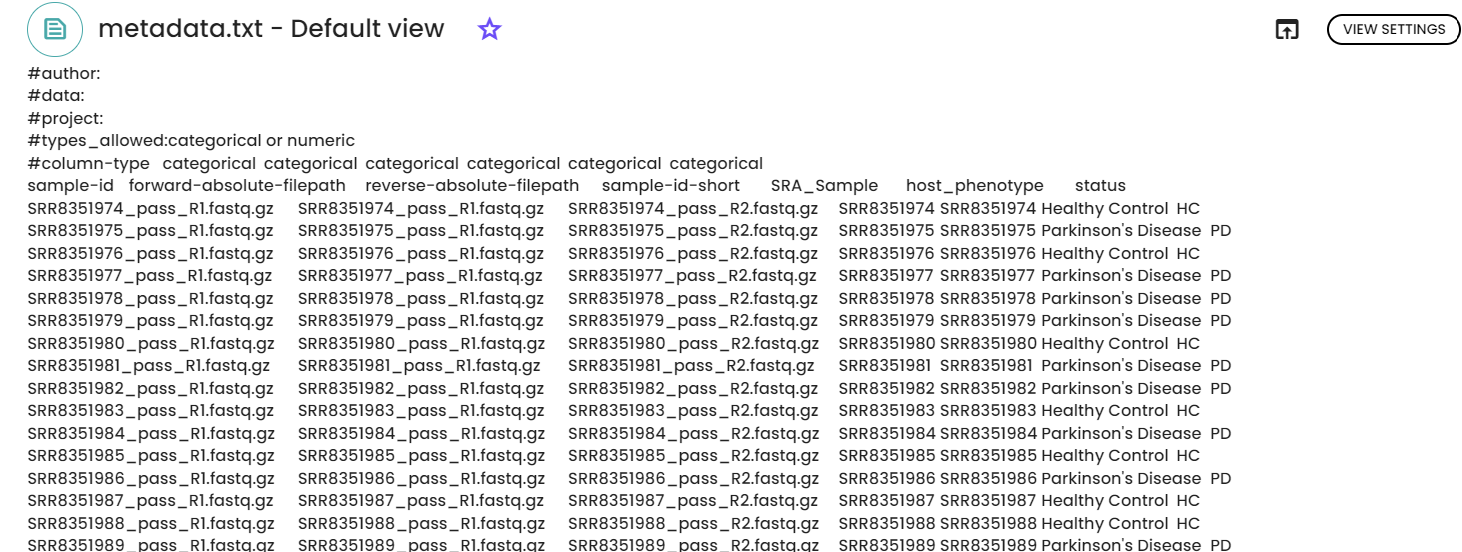
Upload Fastq files as "fastq folder" resource and metadata file as file ressource in Constellab databox.
2. Quality check and denoising
In a new experiment, we integrated the two resources into the initial step of the pipeline, Q2QualityCheck. Since the samples were sequenced using an Illumina sequencer with a paired-end process, we linked the output to the Q2FeatureInferencePE task after performing quality controls. This task describes the inference of ASVs from all samples

3. Diversity analysis and alpha rarefaction curve determination
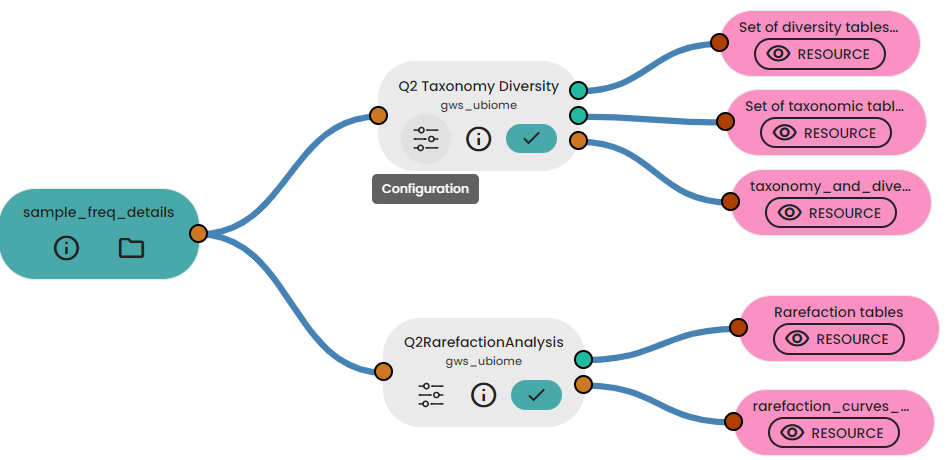
In a follow-up experiment, we utilized the output from the initial experiment in two subsequent tasks: Q2RarefactionAnalysis and Q2RDPAnalysis. The former conducts a rarefaction analysis, generating rarefaction tables and curves for various alpha diversity metrics. Meanwhile, the latter task handles taxonomy annotation.
4. Statistical analysis
In a third experiment, we performed statistical analyses on a specific taxonomic level and we create a figure using a LiveTask.

5. Samples differential analysis
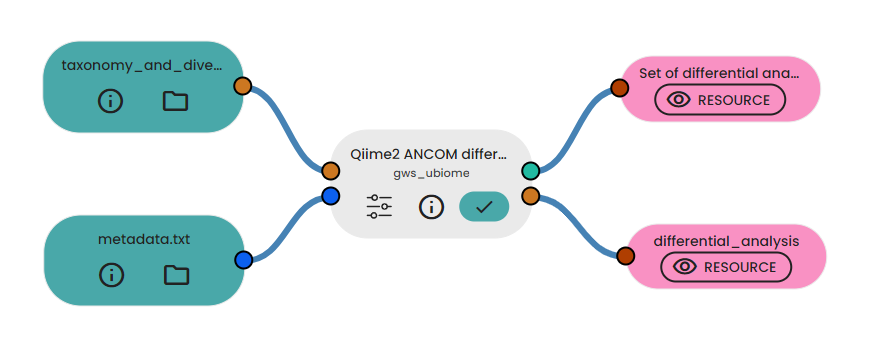
In a fourth experiment, we performed samples differential analysis using ANCOM in order to identify features that are differentially abundant.
6. Functional analysis prediction
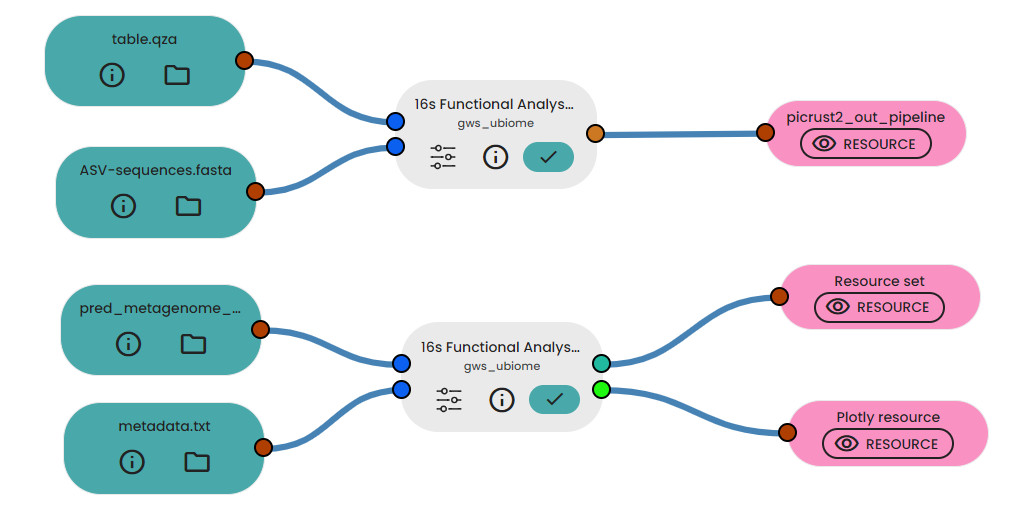
In a final experiment we predicted functional analysis of 16s rRNA data using picrust2 and then we visualized the results using ggpucrust2. We utilized 2 outputs from FeatureInferencePE task to generate picrust2_out_pipeline folder and then
Results
1. Quality check and denoising
The two figures depict the PHRED score across base positions for all samples, separately for i) forward reads and ii) reverse reads. As anticipated, quality diminishes with increasing sequence length. To enhance the quality of ASVs, we trimmed both forward and reverse reads accordingly.


2. Taxonomy and Statistical analysis at the family level
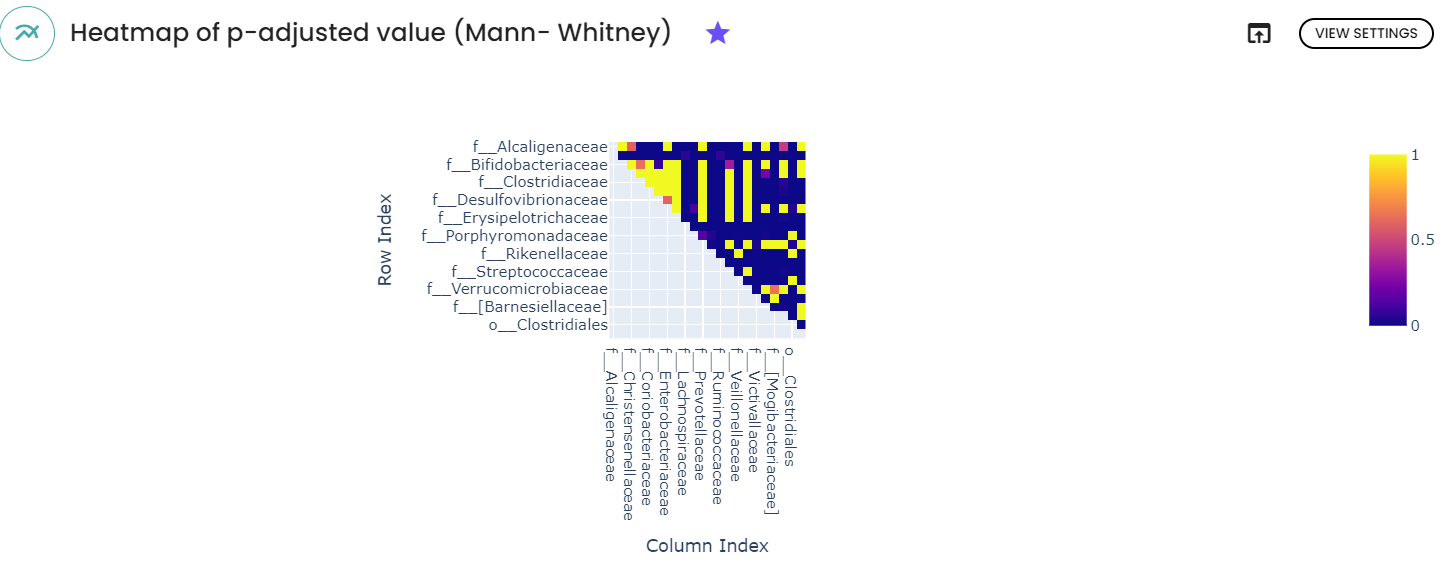
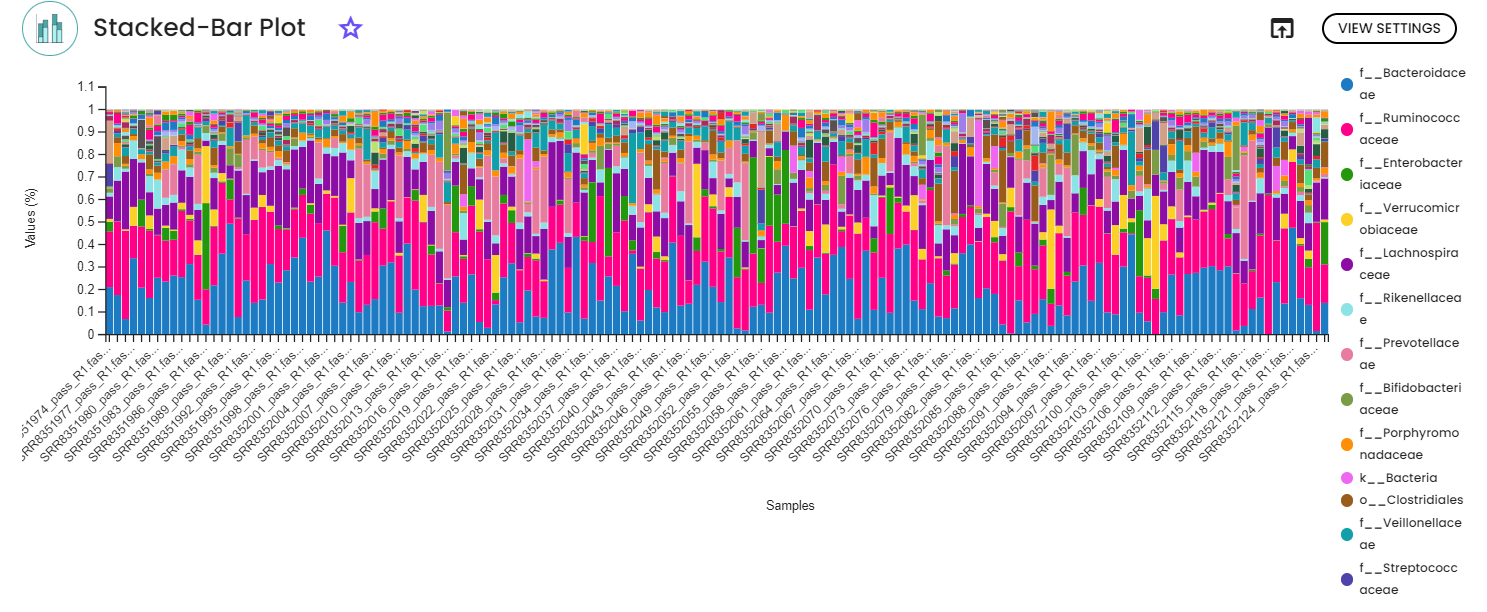
After inferring ASVs, taxonomy classification was performed utilizing the RDP database, with subsequent statistical analysis conducted at the family level. A filter was applied to eliminate rare taxa or those with low abundances. The heatmap presented below illustrates the outcomes of Mann-Whitney comparisons between Parkinson's disease and healthy controls, focusing on family-level differences. Consistent with expectations, significant disparities (after p-value correction) were observed for Enterobacteriaceae, Lachnospiraceae, and Lactobacillaceae. The findings closely mirrored those detailed in the original article, except for Enterococcaceae, which was not identified using the RDP database.
3. Functional analysis Prediction
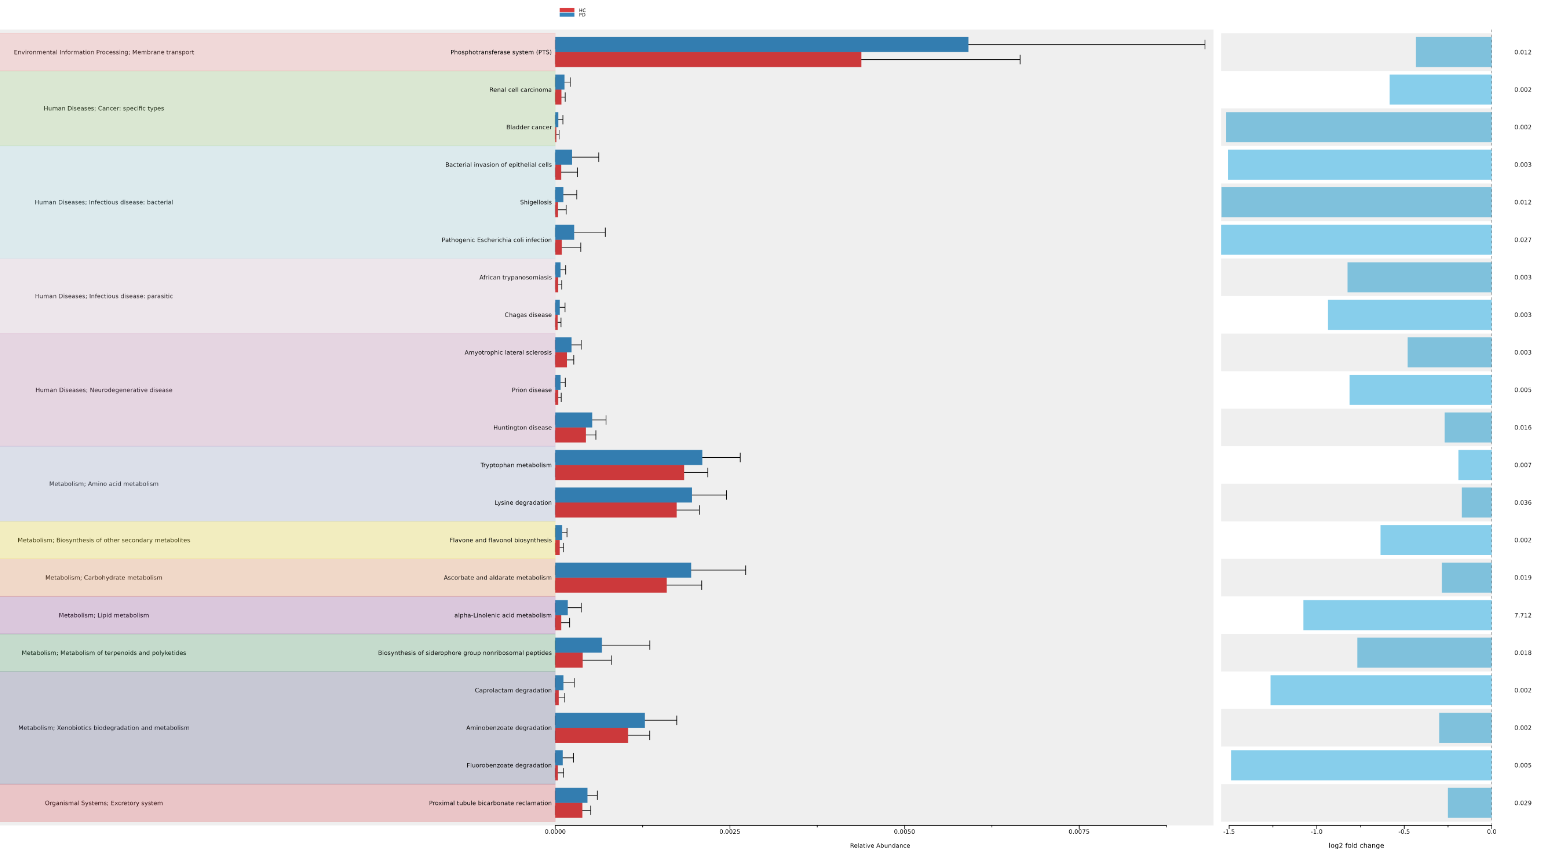
We converted ko abundance which is the abundance of different gene orthologs in your microbial community generated by Picrust2 to kegg pathway abundance that represents the predicted abundance of entire metabolic pathways, which are composed of multiple KO groups. It also involves annotation of pathway and differential abundance (DA) analysis in order to understand the functional potential of your microbial community at the pathway level
Conclusion
This report aims to illustrate a short part of gws_ubiome and gws_stats in Constellab. However, we observed that the results are quite similar to the original article despite the use of different functions, pipelines, and databases.

Comments (0)
Write a comment