Introduction
After matrices loading using "Load count matrices" task and combined.h5ad file generation , applying various filtering criteria is crucial in order to eliminate low quality cells .
Main functions of data filtration using scanpy :
The filtering includes the following steps:
- Filtering genes based on the minimum number of cells expressing each gene (min_cells).
- Filtering cells based on the minimum number of genes detected in each cell (min_genes).
- Keeping cells that fall within the specified range of the number of genes detected (min_n_genes_by_counts and max_n_genes_by_counts).
- Excluding cells with high percentages of counts from mitochondrial genes (max_pct_counts_mt) and ribosomal genes (max_pct_counts_ribo).
Steps to follow
- Ensure that the version 0.1.2 of gws_scomix brick is loaded.
- Then, create a new experiment.
- Import "Data filtration" task available in the brick.
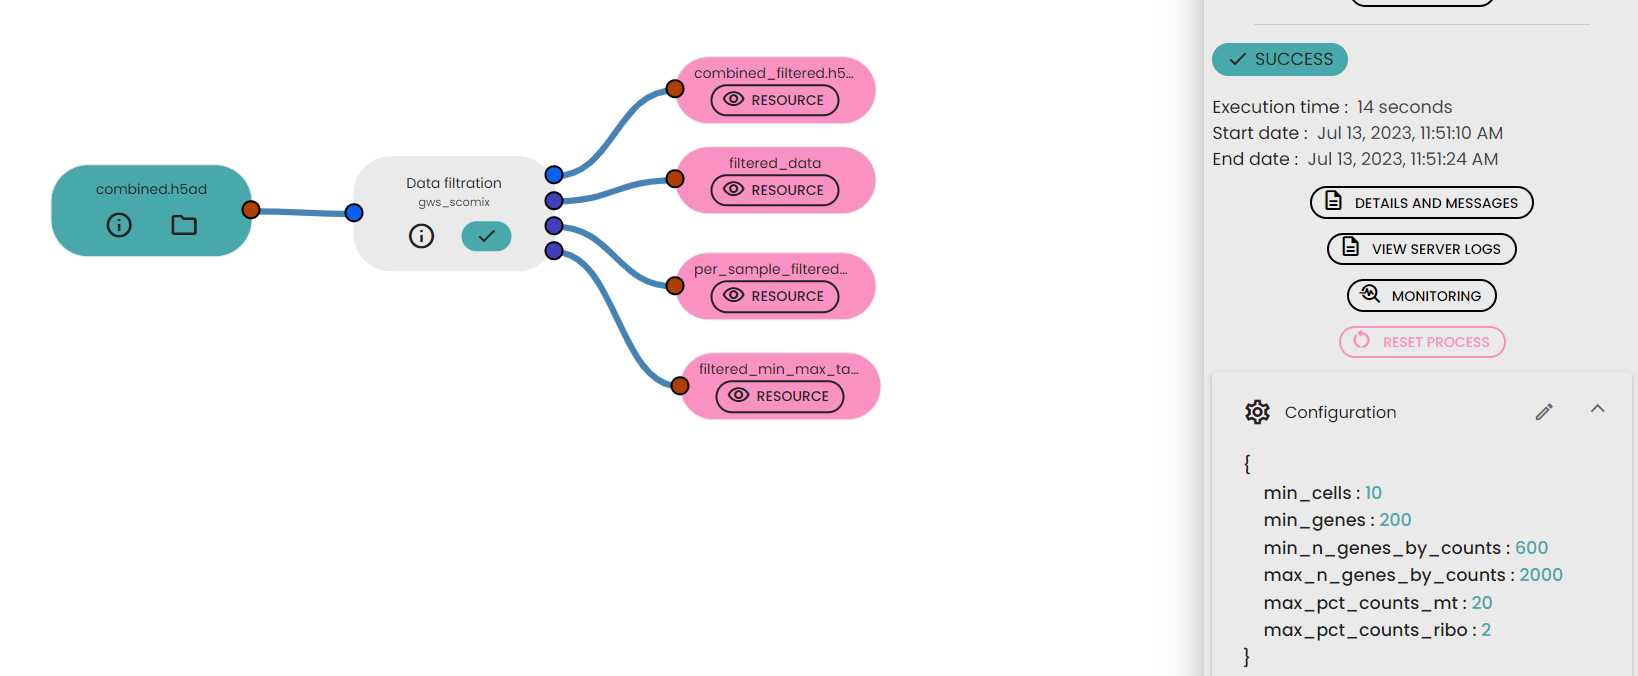
- Add the combined.h5ad file generated by "Load count matrices" task as input ressource file of "Data filtration" task.
- Specify some parameters such as min_cells , min_genes , min_n_genes_by_counts , max_n_genes_by_counts , max_pct_counts_mt, max_pct_counts_ribo
- Run your experiment.
Description of output files
This task will generate :
- combined_filtered.h5ad: This file contains the processed and filtered scRNA-seq data. It includes the gene expression profiles of the filtered cells and associated metadata, such as sample information and QC metrics.
- filtered_data : This table contains selected metadata information for each filtered cell in the scRNA-seq dataset such as the number of genes detected (n_genes_by_counts), total counts, percentages of counts from mitochondrial genes (pct_counts_mt), percentages of counts from ribosomal genes (pct_counts_ribo), and percentages of counts from hemoglobin genes (pct_counts_hb).
- per_sample_filtered_data_information: This table contains statistical information in each sample after applying the data filtering process.
- filtered_min_max_data_information: This table is presenting the minimum and maximum values of essential metrics across the entire filtered dataset. It includes metrics such as the minimum and maximum number of genes detected (n_genes_by_counts), minimum and maximum total counts, minimum and maximum percentages of counts from mitochondrial genes (pct_counts_mt), percentages of counts from ribosomal genes (pct_counts_ribo), and percentages of counts from hemoglobin genes (pct_counts_hb). Additionally, the table contains the total number of cells and genes in the filtered dataset.

Comments (0)
Write a comment