Introduction
AftAfter data integration and clusters identification using "Data integration" task. We can perform automated cell type annotation from marker genes using decoupler tool and PanglaoDB database.
Main functions of data annotation using Decoupler :
- Performs Over-Representation Analysis (ORA) on the input scRNA-seq data using the given marker gene information.
- Evaluates cell type enrichments in different clusters based on marker gene expression patterns.
- Calculates the Activity-by-Cluster (ACT) scores based on the ORA results.
- Scales and processes the ACT scores for visualization.
- Annotate clusters: Ranks and annotates clusters based on significant cell type enrichments using the ACT scores.
Steps to follow
- Ensure that the version 0.1.2 of gws_scomix brick is loaded
- Then, create a new experiment.
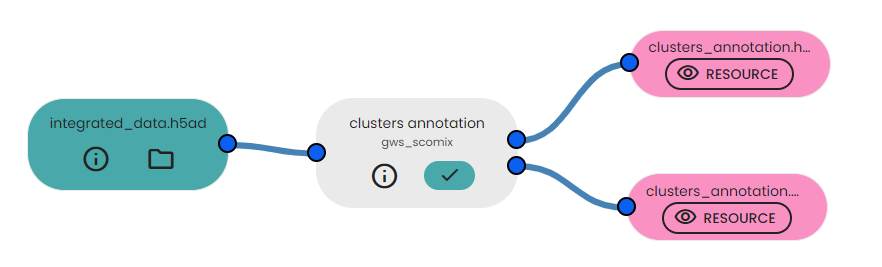
- Import "clusters annotation" task available in the brick.
- Add the integrated_data.h5ad file generated by "Data integration" task as input ressource file.
- Run your experiment.
Description of output files
This task will generate :
- clusters_annotation.h5ad : This file contains the processed and annotated scRNA-seq data after performing data integration and clustering analysis.
- clusters_annotation.png : This PNG image file displays visualizations of the clustered cells for both 'Control' and 'Patient' conditions. The UMAP plots are side-by-side, where each cell is color-coded based on its assigned cell type annotations. The plots offer insights into the cellular heterogeneity and distribution of cell types within different samples or conditions.

Comments (0)
Write a comment