Introduction
In 2023, Batignes et al. published an article intitled "Enhanced Inflammatory Signaling Driven by Metabolic Switch in Aicardi-Goutières Syndrome". Aicardi-Goutières syndrome (AGS) is a genetic disorder driven by type I interferon (IFN), typically manifesting neurological symptoms in childhood. The chronic inflammation triggered by excessive IFN production is linked to IP-10 secretion. In this study, authors utilized single-cell transcriptomic analysis of peripheral blood samples from AGS patients with mutations in SAMHD1, RNASEH2B, or ADAR1 genes. Leveraging machine-learning techniques and differential gene expression analysis, the team observed a significant decrease in the expression and activity of hypoxia-inducible factor 1α (HIF-1α) in monocytes/dendritic cells, accompanied by metabolic shifts and mitochondrial stress.
Prerequesites
To proceed with scRNA-seq analysis on your dataset, you must ensure that the following prerequisites are met
Methods
A use-case in Community describes how to process scRNA-sequencing samples in Constellab. This use case is available on this link.
Steps to follow
In this section, we'll outline the various steps to follow in order to conduct scRNAseq analysis in Constellab
1.Upload data into Constellab databox
Upload Fastq files as "fastq folder" resource in Constellab databox. Create one folder for the control samples and another one for the patient samples. We also need to upload the human reference genome sequences (FASTA file) and human annotations (GTF file) as file resource and whitelist file.
2. Quality check
In a novel experiment, we initially imported the "fastqfolder" resource and executed the "Quality Control" task to scrutinize the quality of reads sourced from a sequencing dataset project.
The outcome of this initial task is connected to "Aggregated Quality Control" with the purpose of consolidating and visualizing quality control outcomes from various analysis tools into a unified report.

3. Genome indexing
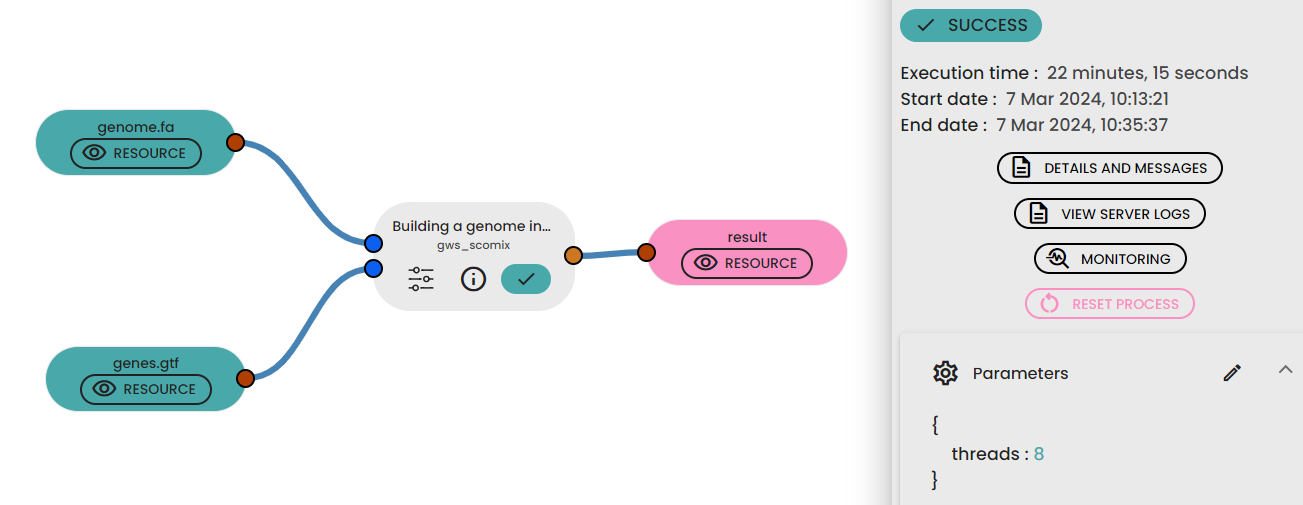
In a subsequent experiment, we utilized reference genome sequence and annotation files to carry out the indexing process of the reference genome.
4. scRNA seq data quantification
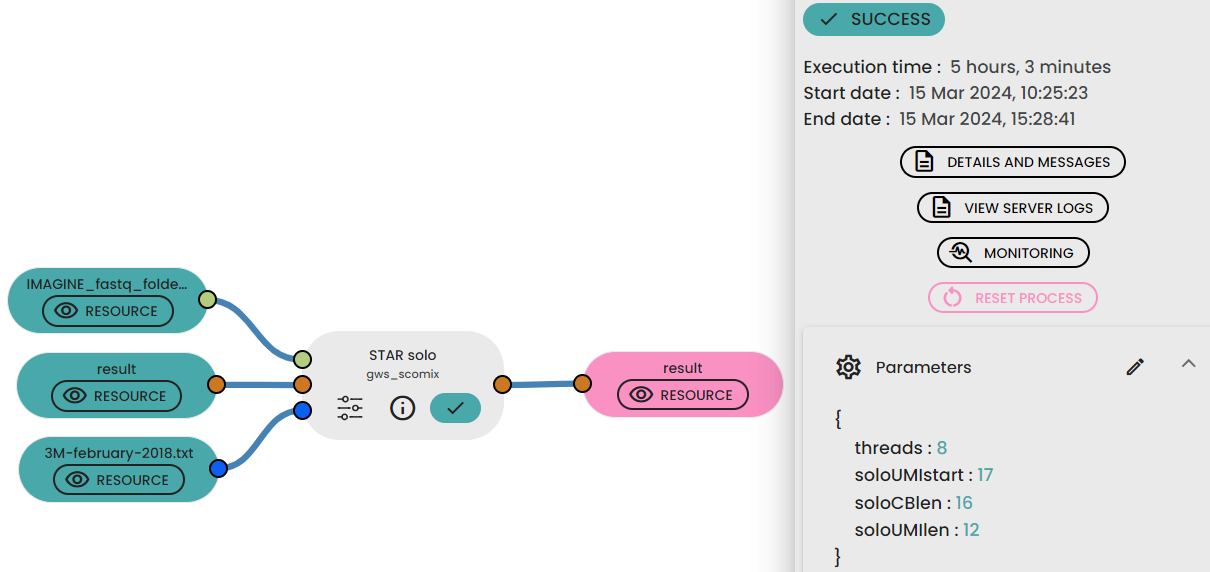
In a new experiment , "STAR solo" task is used for the quantification of per-cell gene expression by counting the number of reads per gene. For this purpose we used the fastq folder, the right version of whitelist file that correspond to the kit used during the experiment and finally the indexed genome as inputs for this task and finally we specified some parameters such as cell barcode length , UMI coding start and length.
5.scRNA-seq downstream analysis
In a final experiment, you can link various tasks detailed in the gws_scomix brick documentation.
These tasks include loading count matrices belonging to multiple samples using "Scanpy Load count matrices" task.
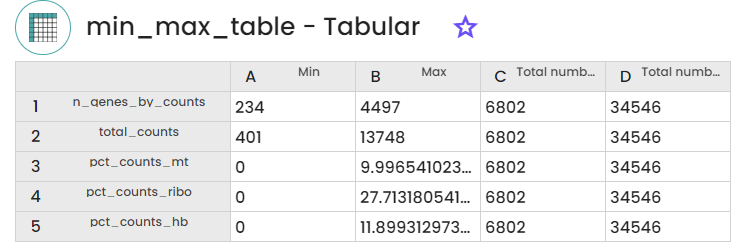
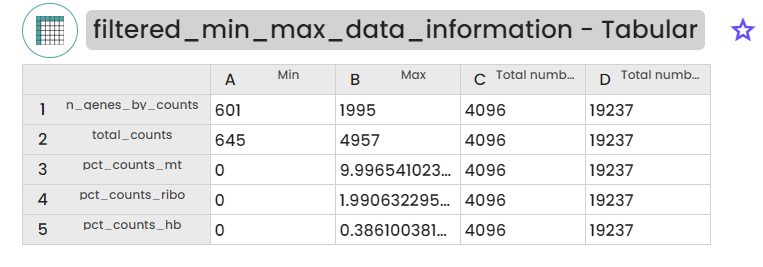
A second step using "Data Filtration" task and aiming at the eliminatiion of low-quality cells based on the results of the previous task. This elimination is assured by applying various filtering criteria such as min_cells, min_genes, min_n_genes_by_counts, max_n_genes_by_counts, max_pct_counts_mt, and max_pct_counts_ribo.
Another task named "Data integration" permitting the elimination of batch effects and clustering based on the Leiden algorithm using the SCVI library, utilizing the output file "combined_filtered.h5ad" generated by the "Data Filtration" task.
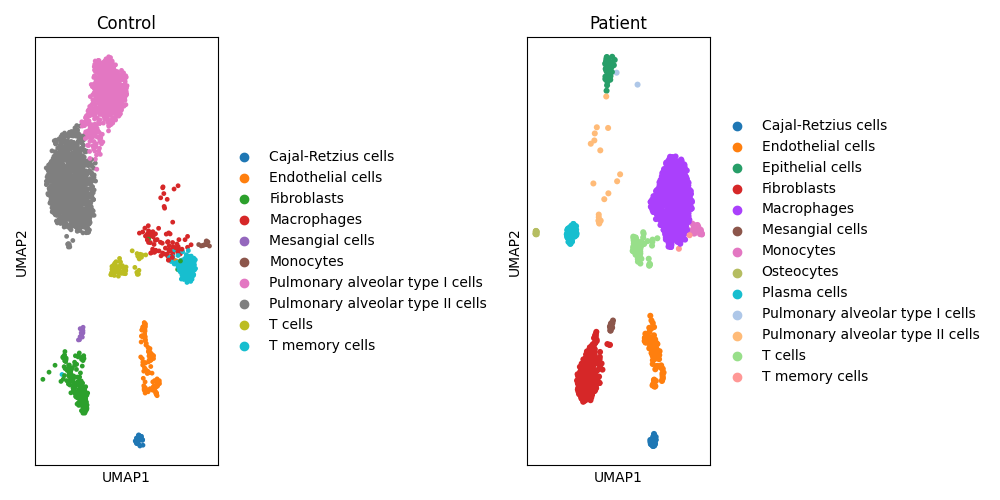
Finally, link the "integrated_data.h5ad" file generated to the Decoupler clusters annotation to enable automated cell type annotation from marker genes using the Decoupler tool and the PanglaoDB database.

Results
1. Quality check
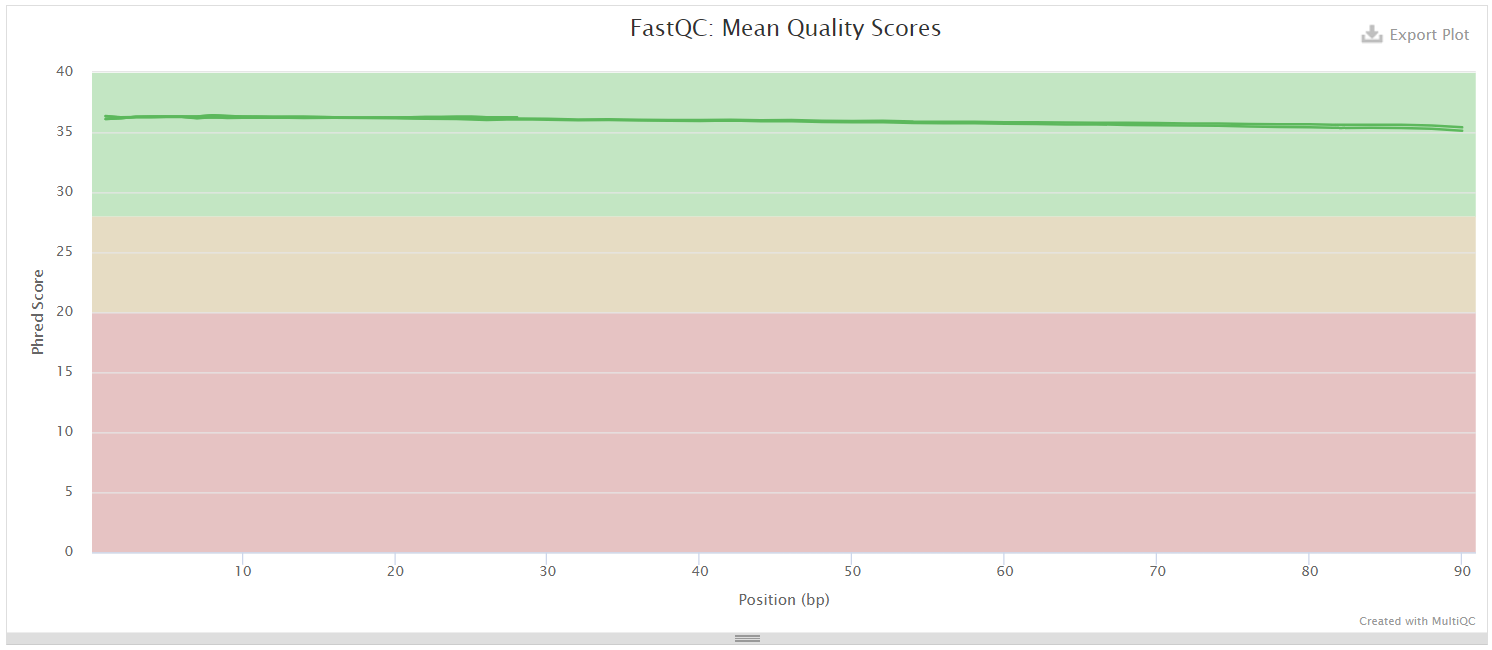
The multiQC file generated for both control and AGS patient indicates the presence of high-quality reads suggests that the sequencing data is of good quality and suitable for downstream analysis.
2. Genome indexing
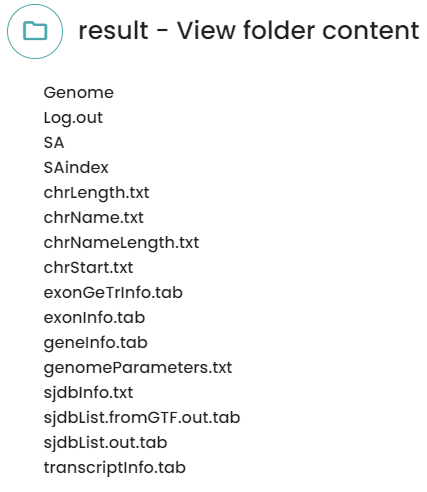
A genome indexes folder was generated. This folder contains human indexing file and enabling efficient alignment of scRNA-seq reads to the reference genome.
3. scRNA seq data quantification
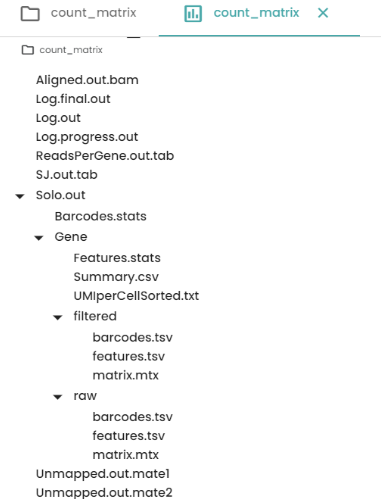
STAR solo generates almost the same files as Cell ranger. Both filtered and raw counts are generated. “Barcodes.tsv” contains the list of unique barcodes associated with each cell in the scRNA-seq dataset. “Features.tsv” contains the list of gene names and “matrix.mtx” stores information about gene expression levels associated with each gene and cell barcode combination.
4.scRNA-seq downstream analysis
This use case outlines the key steps in scRNA-seq data analysis pipeline within Constellab. It begins with loading count matrices from multiple samples, proceeds to data filtration to eliminate low-quality cells, and culminates in data integration and clustering. Automated annotation of cell types from marker genes using Decoupler and PanglaoDB database provides further insights into cellular heterogeneity and distribution within the dataset.
4.1 Data loading
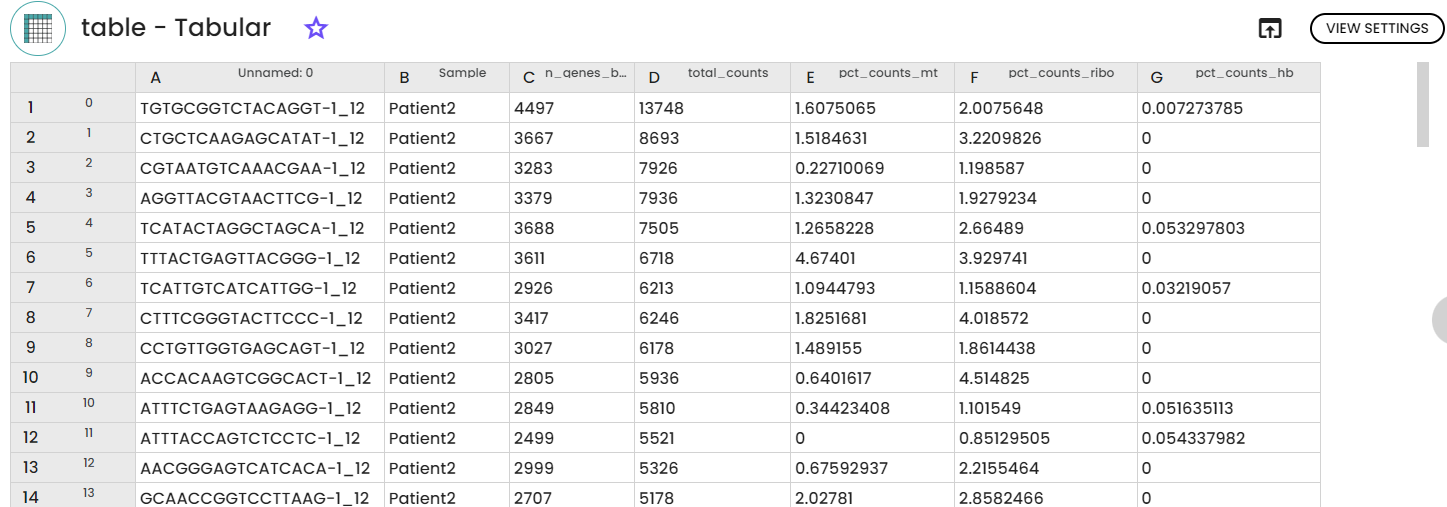
This first step is considered as the first step in scRNA-seq downstream analysis is count matrices loading and pre-processing using scanpy.
4.2 data filtration


4.3 Data integration
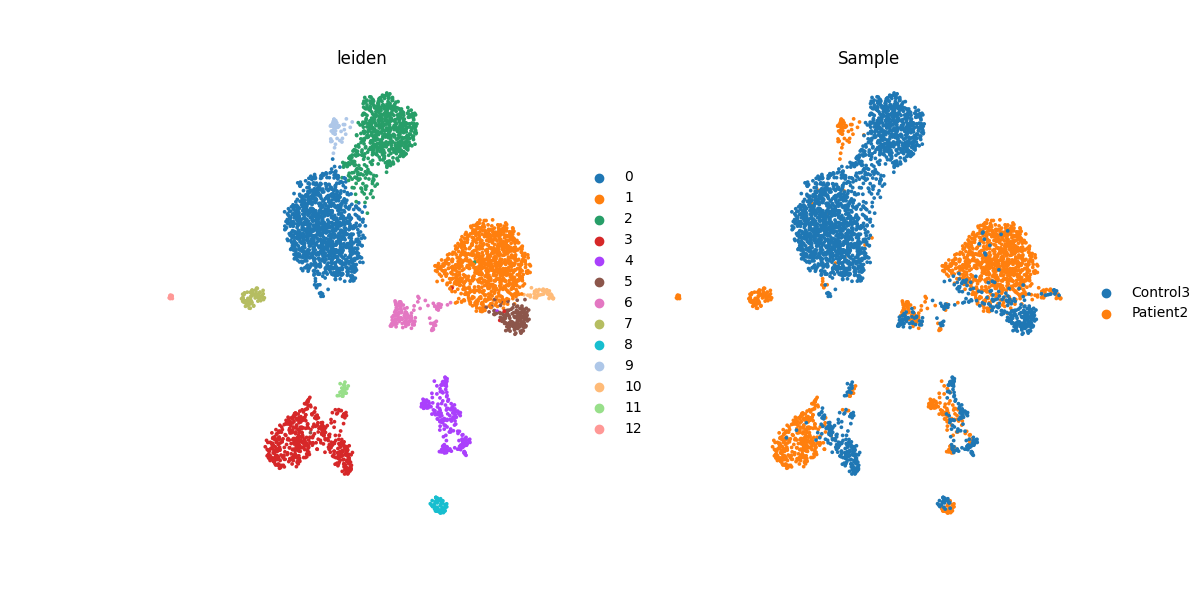
For data integration, Uniform Manifold Approximation and Projection (UMAP) is utilized for visualization and clustering. UMAP is applied to human normal and abnormal PBMC datasets with a single clustering result generated using one resolution parameter via the Leiden algorithm.

4.4 Clusters annotations
Cluster annotation, identified using the Leiden algorithm, was performed by applying an automated package.
Conclusion
This use case serves to highlight a segment of gws_scomix, showcasing results that closely align with those of the original article despite employing distinct functions, pipelines, and databases. Notably, while the original article utilized Seurat instead of Scanpy and relied on manual cluster annotation, Constellab employs an automated annotation process.

Comments (0)
Write a comment