🔍 Introduction
This task wraps g:Profiler to turn long gene lists into interpretable biology. Starting from your DEGs (or any gene list), it performs Over-Representation Analysis (ORA) against well-curated knowledge bases (GO: BP/MF/CC, KEGG, …), applies multiple-testing correction (g:SCS by default), and returns clean tables plus ready-to-use visualizations.
Use it when you want quick, reproducible functional insights without maintaining local annotation databases. The task also builds an interactive Terms × Genes grid so you can see which genes drive each enriched term at a glance.
In this demonstration, data were retrieved from this article "Airway Smooth Muscle–Specific Transcriptomic Signatures of Glucocorticoid Exposure"
🧰 Prerequisites
- Access to Constellab and a valid Digital Lab environment
- Installed bricks: gws_omix ≥ 0.11.12
- A CSV/TSV results file (e.g., from DESeq2 or edgeR) containing: an ID column (Ensembl, symbols, or mixed), optionally p-values / padj and log2FoldChange (used for filtering & bubble sizes)
- an ID column (Ensembl, symbols, or mixed),
- optionally p-values / padj and log2FoldChange (used for filtering & bubble sizes)
🧪 Workflow: Step-by-Step
- Add the task Select OmiX – Functional enrichment analysis based on ORA in Constellab.
- Provide input Attach your DE/Full results table (CSV/TSV).
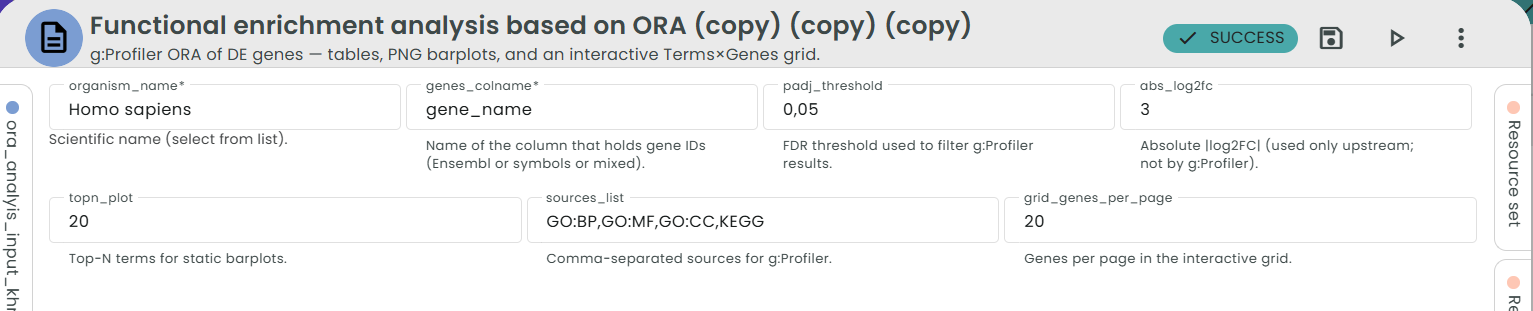
- Configure parameters
- organism_name – Scientific name (e.g., Homo sapiens).
- genes_colname – Which column contains gene IDs (Ensembl or symbols).
- padj_threshold – FDR cutoff to filter DEGs before ORA (e.g., 0.05).
- abs_log2fc – |log2FC| cutoff for UP/DOWN subsets (optional; 0 to disable).
- sources_list – Comma-separated sources to test (default:
GO:BP,GO:MF,GO:CC,KEGG). - topn_plot – Top-N terms for static barplots (default: 20).
- grid_genes_per_page – Page size for the interactive grid (default: 25).
Tip: If your table contains mixed identifiers (Ensembl + symbols), the task internally normalizes IDs via g:Profiler ,no manual preprocessing needed.
4. Run the task
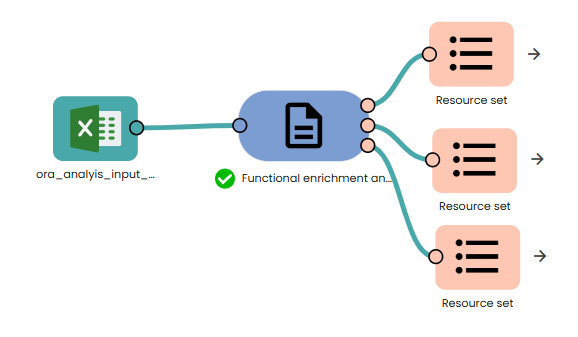
📤 Outputs
You’ll get three output groups:
1) ORA tables
One CSV per gene set (ALL_DE, UP_DE, DOWN_DE).
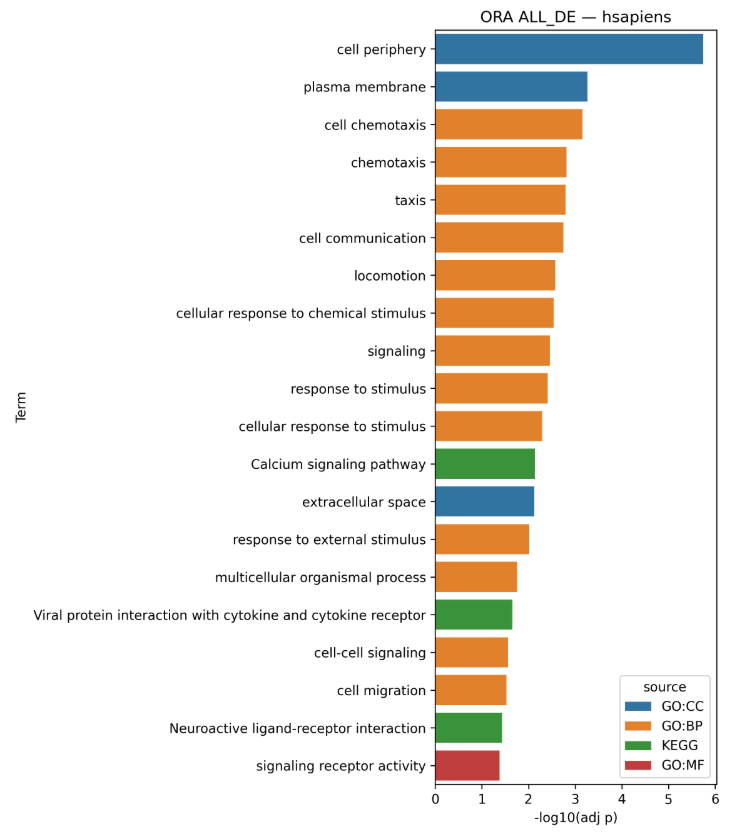
2) Barplots
For each gene set, a static Top-N barplot of most significant terms (default N=20).
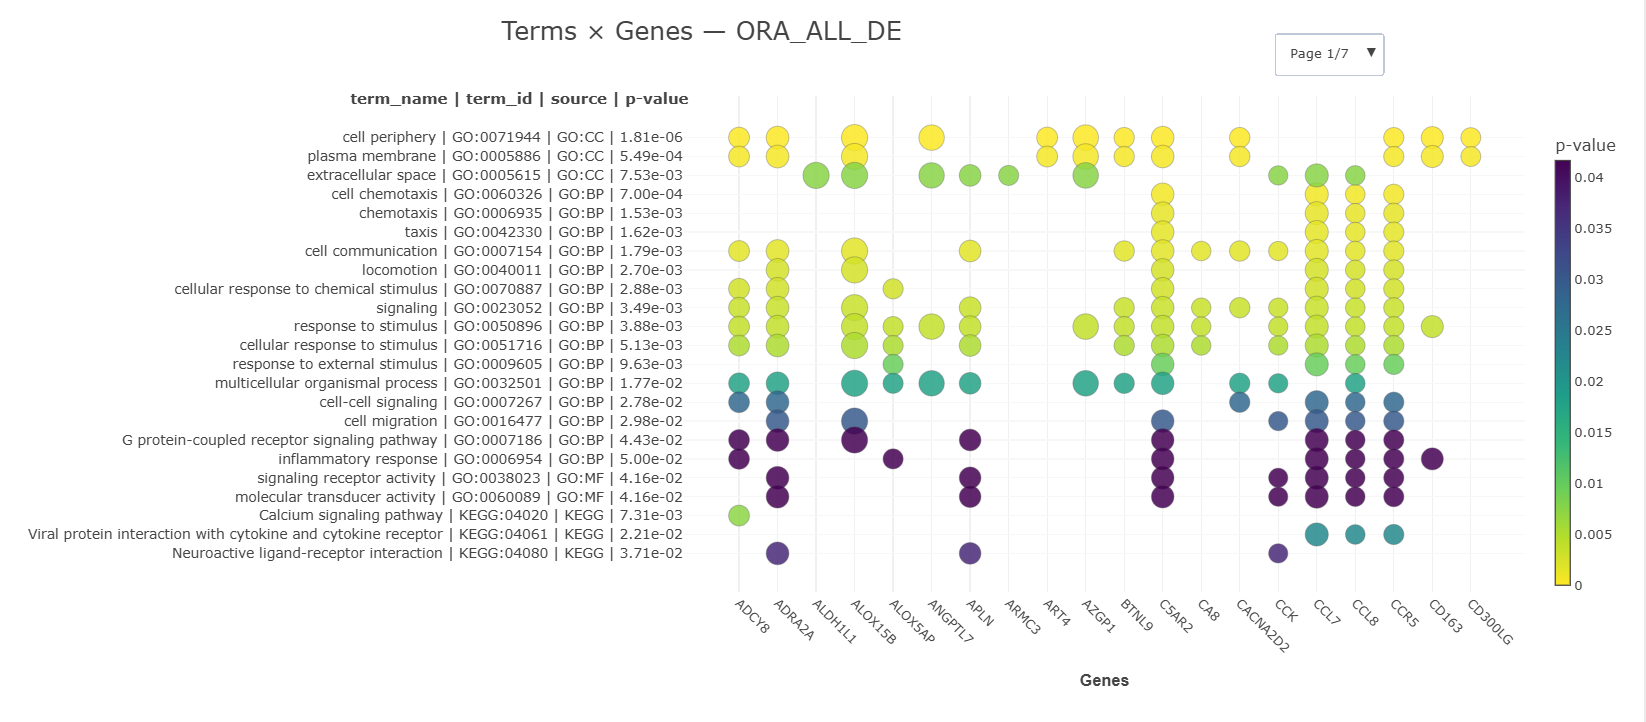
3) Interactive Terms × Genes
A browsable grid where:
- Rows = enriched terms (grouped by source; long labels stay readable)
- Columns = genes (paginated if many)
- Bubble color = term p-value (more intense = more significant)
- Bubble size = |log2FC| of the gene (if available; else a default size)
- Tooltips show exact term, gene, and p-value; a colorbar explains the scale.

Comments (0)
Write a comment