Introduction
After data filtration using "Data filtration" task we proceed to data normalization and then data integration using scVI (single-cell Variational Inference). In fact scVI is a method based on a conditional variational auto encoder [Lopez et al., 2018] available in the scvi-tools package [Gayoso et al., 2022]. This step permit the elimination of batch effect and then clusters determination based on leiden algorithm [Traag et al. (2018)], an improved version of the Louvain algorithm [Blondel et al. (2008)]. As input, this task will take the combined_filtered.h5ad file generated by "Data filtration" task.
Main functions of data integration using scVI :
- Normalization: Scanpy provides functions to normalize the gene expression data, ensuring that cells are comparable.
- Gene selection: Identifying highly variable genes that contribute significantly to cell heterogeneity.
- scVI Integration: Utilizing scVI, an unsupervised deep generative model, to integrate multiple scRNA-seq datasets from different experiments or batches into a shared latent space.
- Leiden Clustering: Utilizing the Leiden algorithm, an extension of the Louvain algorithm, to group cells into distinct clusters based on shared similarities in the integrated space.
Steps to follow
- Ensure that the version 0.1.2 of gws_scomix brick is loaded
- Then, create a new experiment.
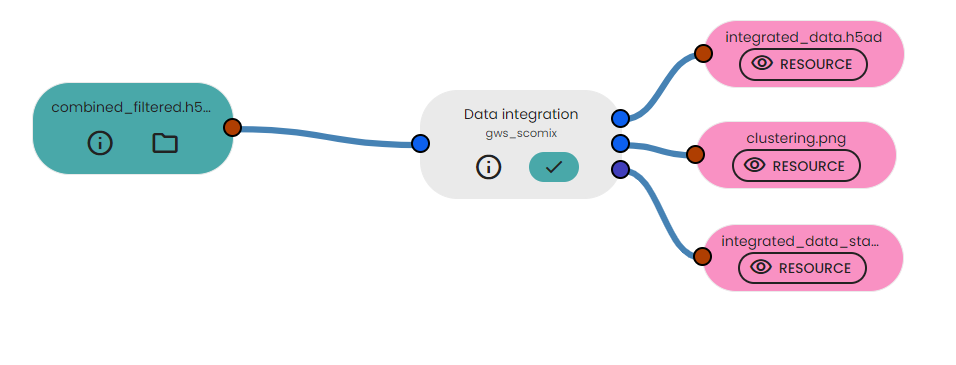
- Import "Data integration" task.
- Add the combined_filtered.h5ad file generated by "Data filtration" as input ressource file.
- Specify some parameters such clusters resolution value which is a parameter that controls the granularity of the clustering algorithm, influencing the number and size of the resulting clusters. In fact , a lower cluster resolution value will lead to more fine-grained clustering, where cells with subtle differences in gene expression will be separated into smaller clusters.
- Run your experiment.
Description of output files
This task will generate :
- integrated_data.h5ad: This file contains the integrated single-cell RNA sequencing (scRNA-seq) data after the data integration process. It stores the integrated gene expression profiles of individual cells, along with associated metadata, clustering results, and visualization coordinates (UMAP).
- clustering.png : The image displays two subplots side by side, each showing the UMAP visualization of the integrated cells colored by cluster assignment (leiden) and sample identifier. This visualization allows for a visual inspection of the integrated data's clustering patterns, facilitating the identification of distinct cell populations and potential biological insights.
- integrated_data_statistical_informations : This table includes the total number of cells and the total number of genes present in the integrated dataset.

Comments (0)
Write a comment