Introduction
Oxford Nanopore Technologies (ONT) sequencing has emerged as a powerful tool for genetic variant detection, thanks to its ability to generate long, continuous reads. Unlike short-read sequencing technologies, ONT facilitates the accurate identification of structural variants, such as insertions, deletions, and translocations, which are often challenging to detect with traditional sequencing methods. Furthermore, its capability for real-time data analysis makes it particularly valuable for both clinical applications such as rapid genetic disease diagnosis and fundamental research, including the study of somatic mutations and genomic evolution. Given the increasing adoption of ONT sequencing in genomics, developing robust bioinformatics pipelines for variant detection is essential to maximize its potential in both research and clinical settings.
Data upload and preparation
Input fastq folder and reference genome file(s)
You need to upload a FASTQ folder that contains all the samples, organized by barcode. The pipeline also supports the ability to process multiplexed data
Protocol
STEP 1 - Read classification
Purpose
A Python script has been implemented to classify sequencing reads from multiplexed experiments.
Each read is aligned to reference sequences corresponding, for example, to specific genes. These reads are then grouped by gene based on their alignment identity.
The methodology relies on the combined use of Mappy and Pysam, two powerful and complementary Python libraries for bioinformatics.
Mappy, an interface for the fast alignment tool Minimap2, enables efficient alignment of long reads — such as those produced by Oxford Nanopore Technologies — to a merged reference FASTA containing all genes of interest.
The FASTQ files generated for each barcode are processed with Pysam, a library for reading and writing genomic data (FASTQ, SAM, BAM). Each read is compared to reference sequences, and if its identity score exceeds a predefined threshold (e.g., 60%), it is classified into a gene-specific subfolder, allowing targeted downstream analysis.
This stage thus performs per-gene read classification by aligning each sequencing read to the appropriate reference, ensuring that only reads with sufficient identity are retained and correctly grouped.
Processing Workflow
1) Directory traversal (barcodes)
- The script recursively processes each subdirectory (typically
barcodeXX) under the input folder, handling all *.fastq.gz files.
2) Aligner initialization
- A merged reference FASTA file is loaded via:
aligner = mp.Aligner(merged_reference_fasta, preset="map-ont").
- Each contig (sequence) in the merged reference corresponds to a gene.
3) Alignment and classification logic
- Each read is aligned against the reference set using Mappy/Minimap2.
- The identity is computed as: Identity (%)=(mlen/blen)×100
• mlen = number of matching bases in the aligned segment
• blen = alignment block length
- If the computed identity ≥ configured threshold (60% in the default script), the read is classified under the corresponding gene (
hit.ctg).
Results
Gene-wise output generation
- For each gene, reads are written (in append mode) to:
output_dir/<gene>/<barcode>-<gene>.fastq.gz.

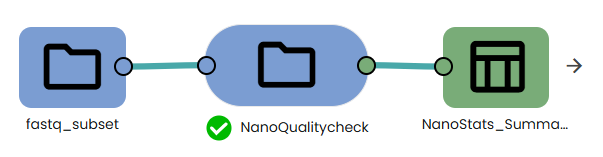
STEP 2 -NanoQualitycheck
Purpose
This stage performs an automated quality assessment of Nanopore (ONT) sequencing reads using NanoPlot, a visualization and statistics tool designed for long-read sequencing technologies.
It generates individual quality reports for each barcode and compiles key statistical metrics into a single summary table to provide an overall overview of sequencing performance and data integrity.
Processing Workflow
1. Per-sample NanoPlot Execution
- Each FASTQ or FASTQ.GZ file is automatically processed with NanoPlot using the parameters
--tsv_stats --raw --threads <N>.
- NanoPlot computes and visualizes multiple quality metrics, including read length, base composition, and per-read Phred quality distributions.
- Output files (
NanoStats.txt, plots, and TSV summaries) are stored in dedicated subfolders for each barcode.
Results
Statistical Metrics Extraction
NanoPlot generates key quality indicators such as:
- Number of Reads: total count of sequencing reads per sample.
- Number of Bases: cumulative number of sequenced nucleotides.
- Median Read Length: central value of the read length distribution.
- Mean Read Length: average read length calculated as total bases ÷ number of reads.
- Quality Thresholds Q10, Q15, Q20): number of reads exceeding each Phred score threshold.
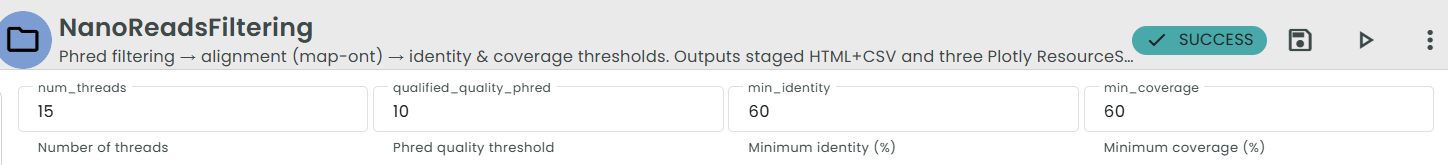
STEP 3 -NanoReadsFiltering
Purpose
This stage cleans and filters raw Nanopore (ONT) reads before alignment by applying sequential quality, identity, and coverage filters.
It ensures high-confidence reads suitable for downstream analyses
Processing Workflow
- Phred Filtering (
chopper -q <phred>)
Each FASTQ(.gz) file is filtered based on a minimum Phred quality threshold.
Reads below the threshold are discarded.
- Per-read Alignment (minimap2/mappy, preset
map-ont)
Each remaining read is aligned to the reference genome to evaluate its mapping quality.
- Identity and Coverage FilteringIdentity (%)=(mlen/blen)×100mlen = number of matching bases in the aligned segment
blen = alignment block length
Coverage (%)=(qen−qst/read length)*100where q_st and q_en are the start and end coordinates on the read.
This is a read-centric coverage metric.
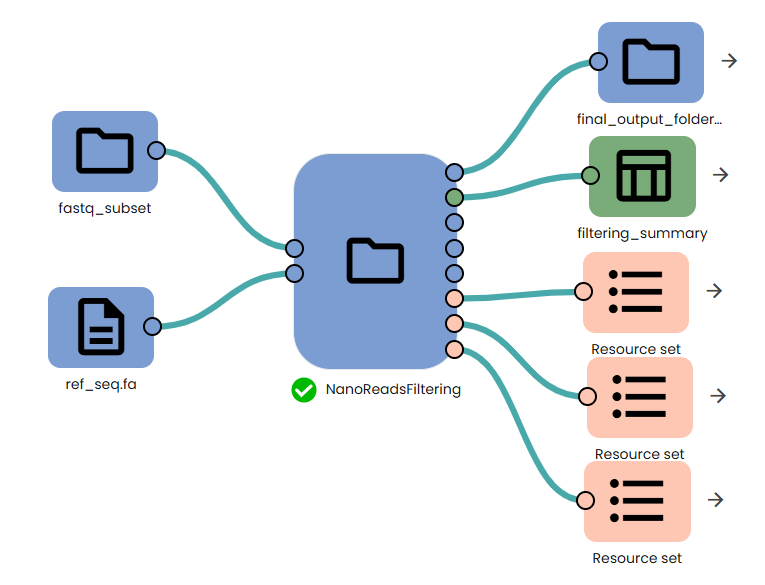
3. Results
- Per-sample Outputs Filtered FASTQ files after identity/coverage filtering
- Three interactive Plotly ResourceSets: (histograms + descriptive stats) :
- RAW (before Phred): length & coverage distributions
- After Phred: length & coverage distributions
- After Identity/Coverage: final distributions
- Each plot includes an on-graph statistics panel (mean, median, quantiles, etc.).
Only reads that meet all quality, identity, and coverage criteria are retained.
Distributions provide a clear visualization of filtering effects across stages.
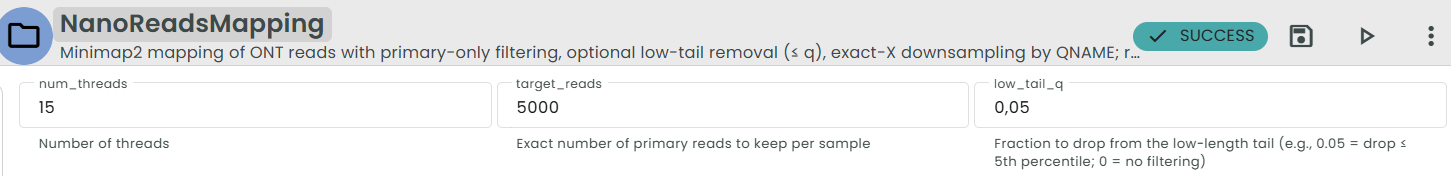
STEP 4 -NanoReadsMapping
1. Purpose
This step aligns Oxford Nanopore (ONT) sequencing reads against a reference genome using Minimap2, generating high-quality alignment files and summary statistics.
It provides detailed insight into read length and coverage distributions and produces indexed BAM files ready for downstream analyses.
2. Process Description
- Mapping with Minimap2 (preset
map-ont)Each FASTQ(.gz) file is aligned to the reference genome.
Secondary and supplementary alignments are excluded to retain only primary mappings (the main alignment per read).
- Optional: Removal of shortest readsIf
low_tail_q is specified, the shortest fraction (≤ q-quantile) of reads is filtered out based on read length distribution (this param is set to 5% (0.05) by default in this task.
- Exact Downsampling by QNAMEWhen
target_reads > 0, the pipeline performs exact downsampling by read identifiers (QNAME), ensuring reproducibility.
- BAM Sorting and IndexingAlignments are sorted by genomic position (
samtools sort) and indexed (.bai) for efficient access.
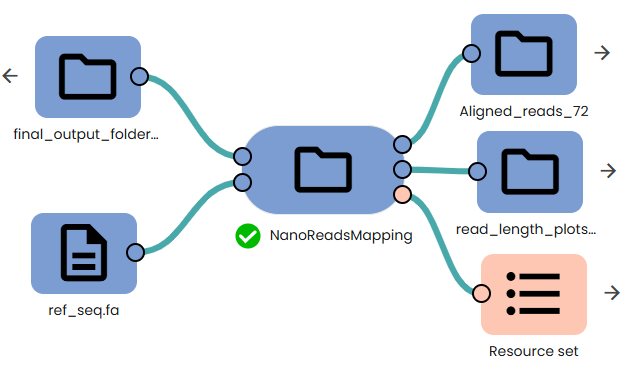
3. Results
- Per-Sample OutputsBAM Files:
<sample>.sorted.bam (final sorted alignments)
<sample>.sorted.bam.bai (index)
- Additional OutputsA Plotly ResourceSet containing all interactive plots as the one generating in the previous step but this time on the X target_reads selected:
- Histograms for read length and coverage distributions.
- Statistical summaries (mean, median, quartiles, extended quantiles) displayed on the right of each figure
