Introduction
We present here a user case on the analysis of the Iris dataset with the T-Test statistical method,
. The Iris dataset consists of 50 samples from each of three species of Iris flower (Iris setosa, Iris virginica and Iris versicolor). Four features were measured from each sample: the length and the width of the sepals and petals, in centimeters. One can wonder whether a feature differs between two species, for example Iris setosa, Iris virginica. To address this question, one can perform a statistical T-test to quantitatively assess whether a specific feature differs significantly between two given species.
Protocol steps
STEP 1 Data preparation and preliminary analysisWe start by loading the iris dataset from our computer in the Databox of the Lab. One can then have a preview of the dataset by clicking on the imported file.
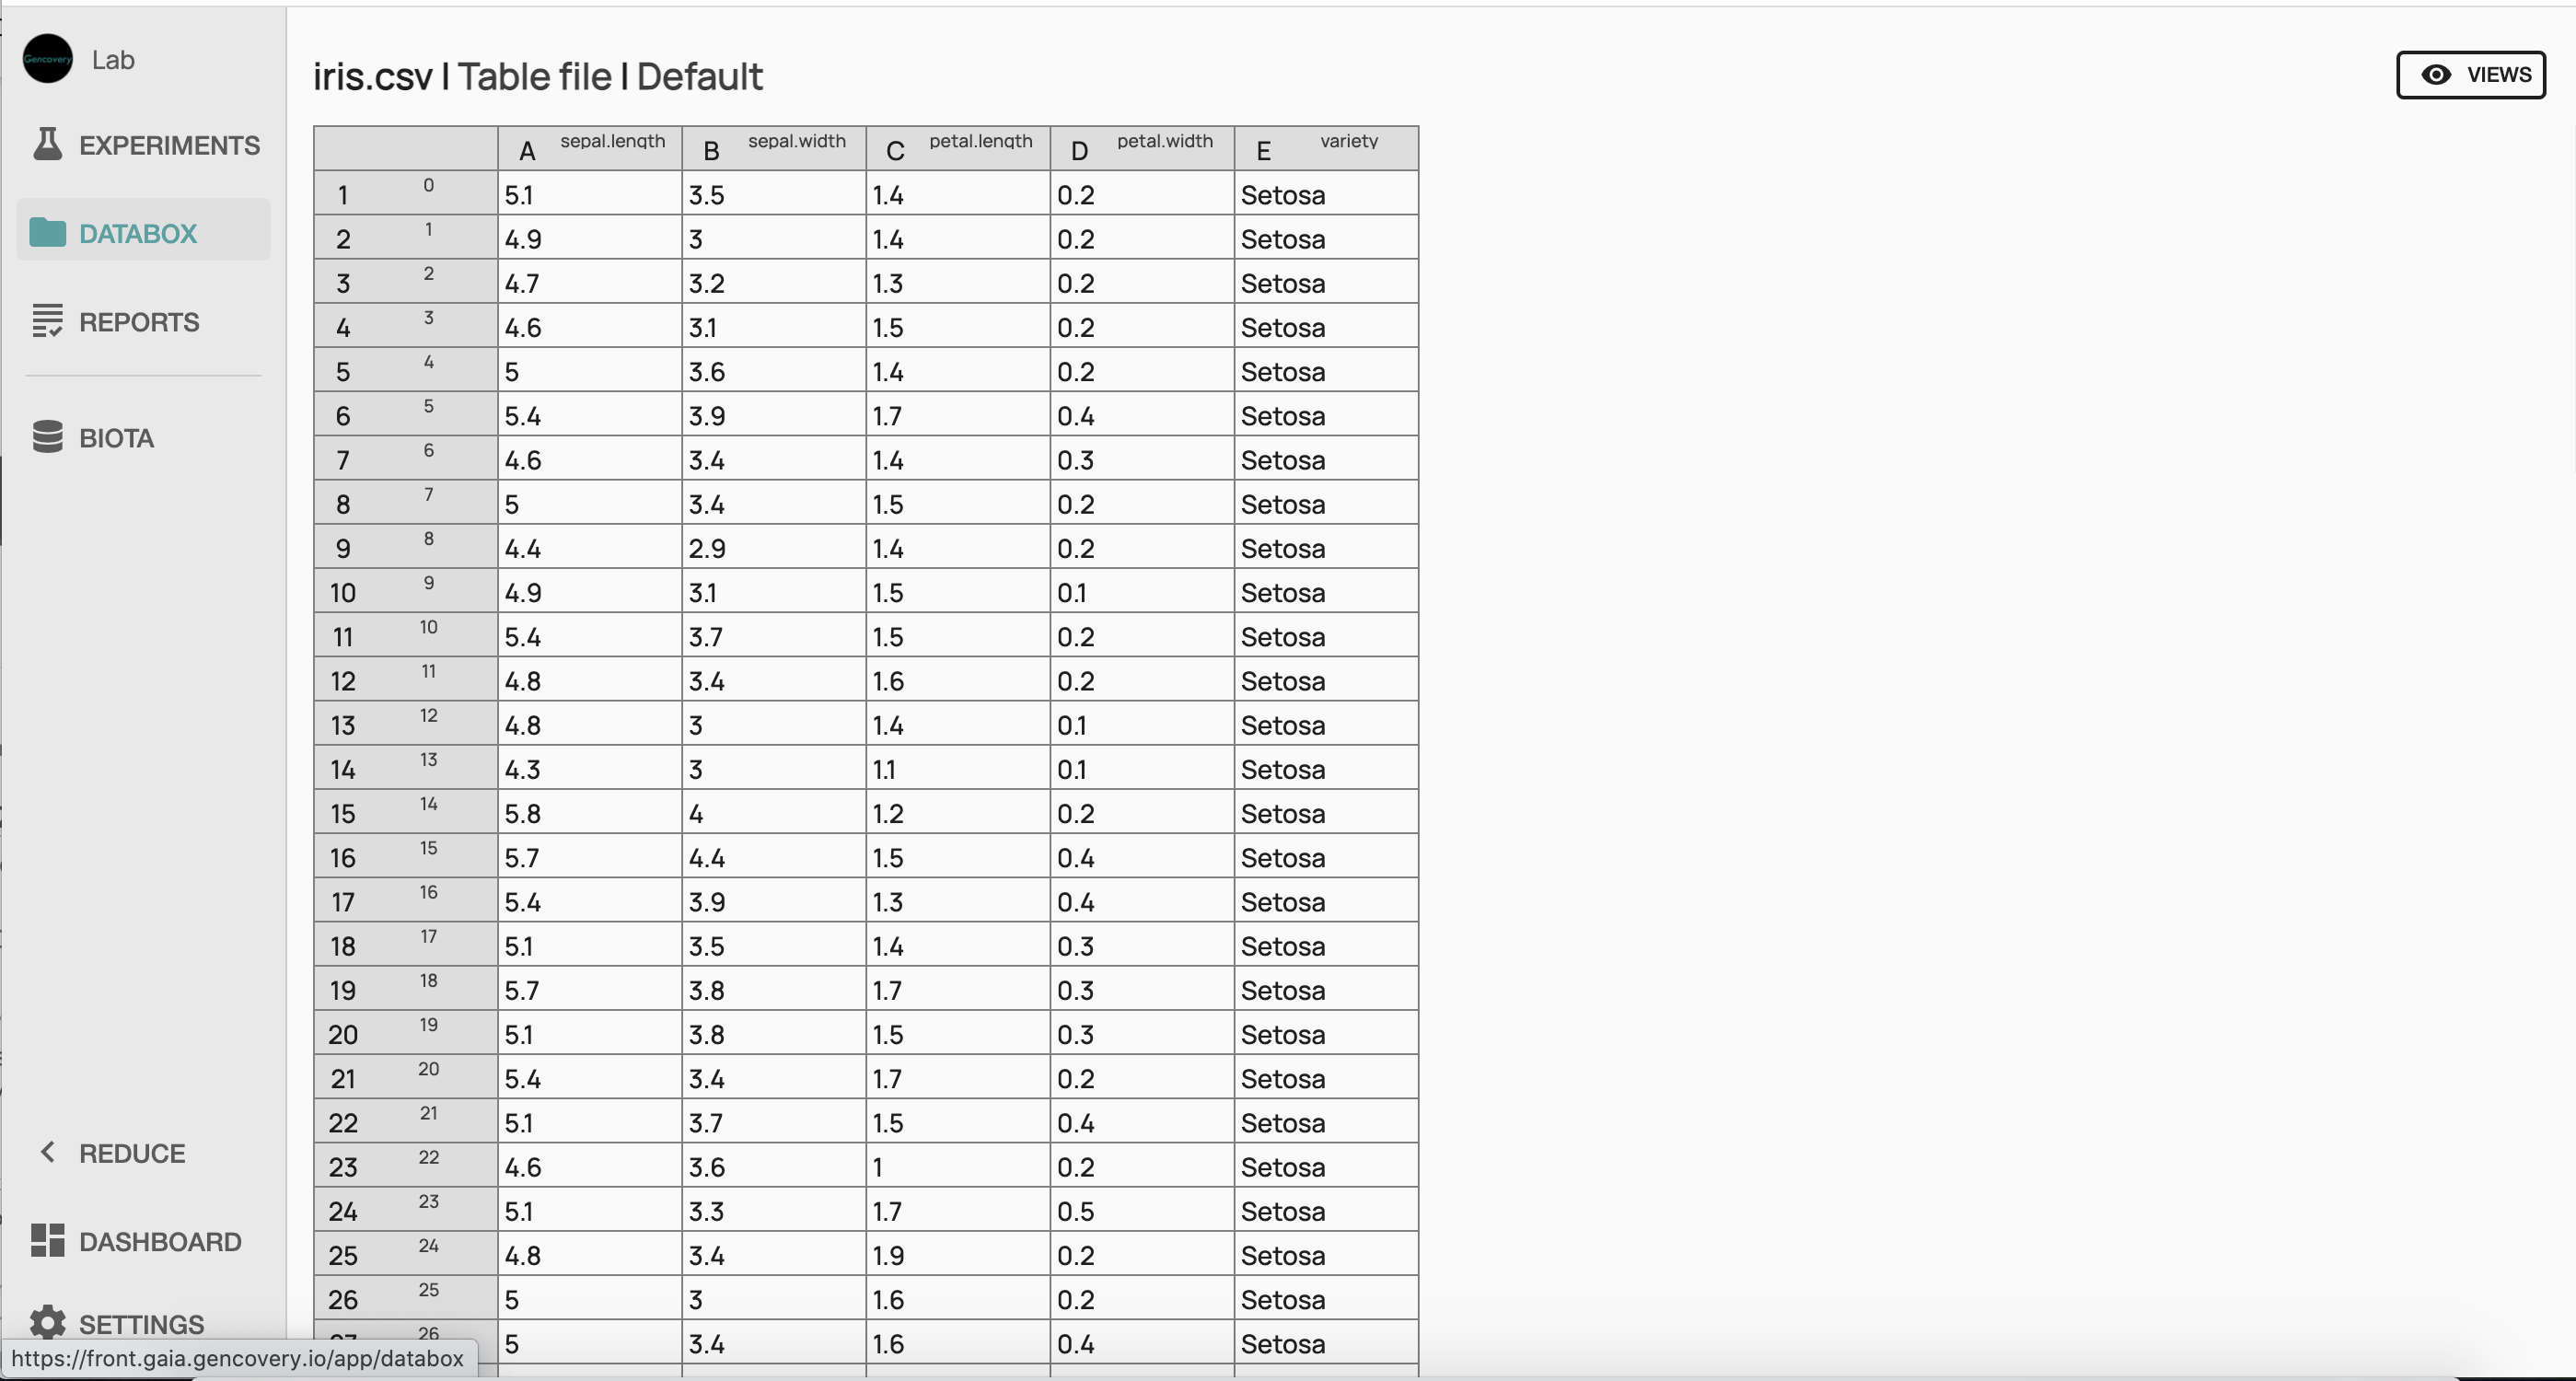
Here the first 4 columns correspond to each of the 4 features of the dataset (the sepal length, the sepal width, the petal length, the petal width, in centimeters), while each line corresponds to a sample of the dataset. The last column indicates the corresponding species (setosa, virginica or versicolor).
We then process the data in order to extract the sepal length of each sample for each iris species. To do so, we first tag the samples according to the species to which they belong, by specifying in the metadata field when importing the resource the name of the column indicating the corresponding species of each sample.
Once our data tagged, we can use our panel of transformers to unfold our data. This process reorganises our data to get as columns features associated to each species. We now just have to extract the columns corresponding to sepal length feature using again our panel of transformers.
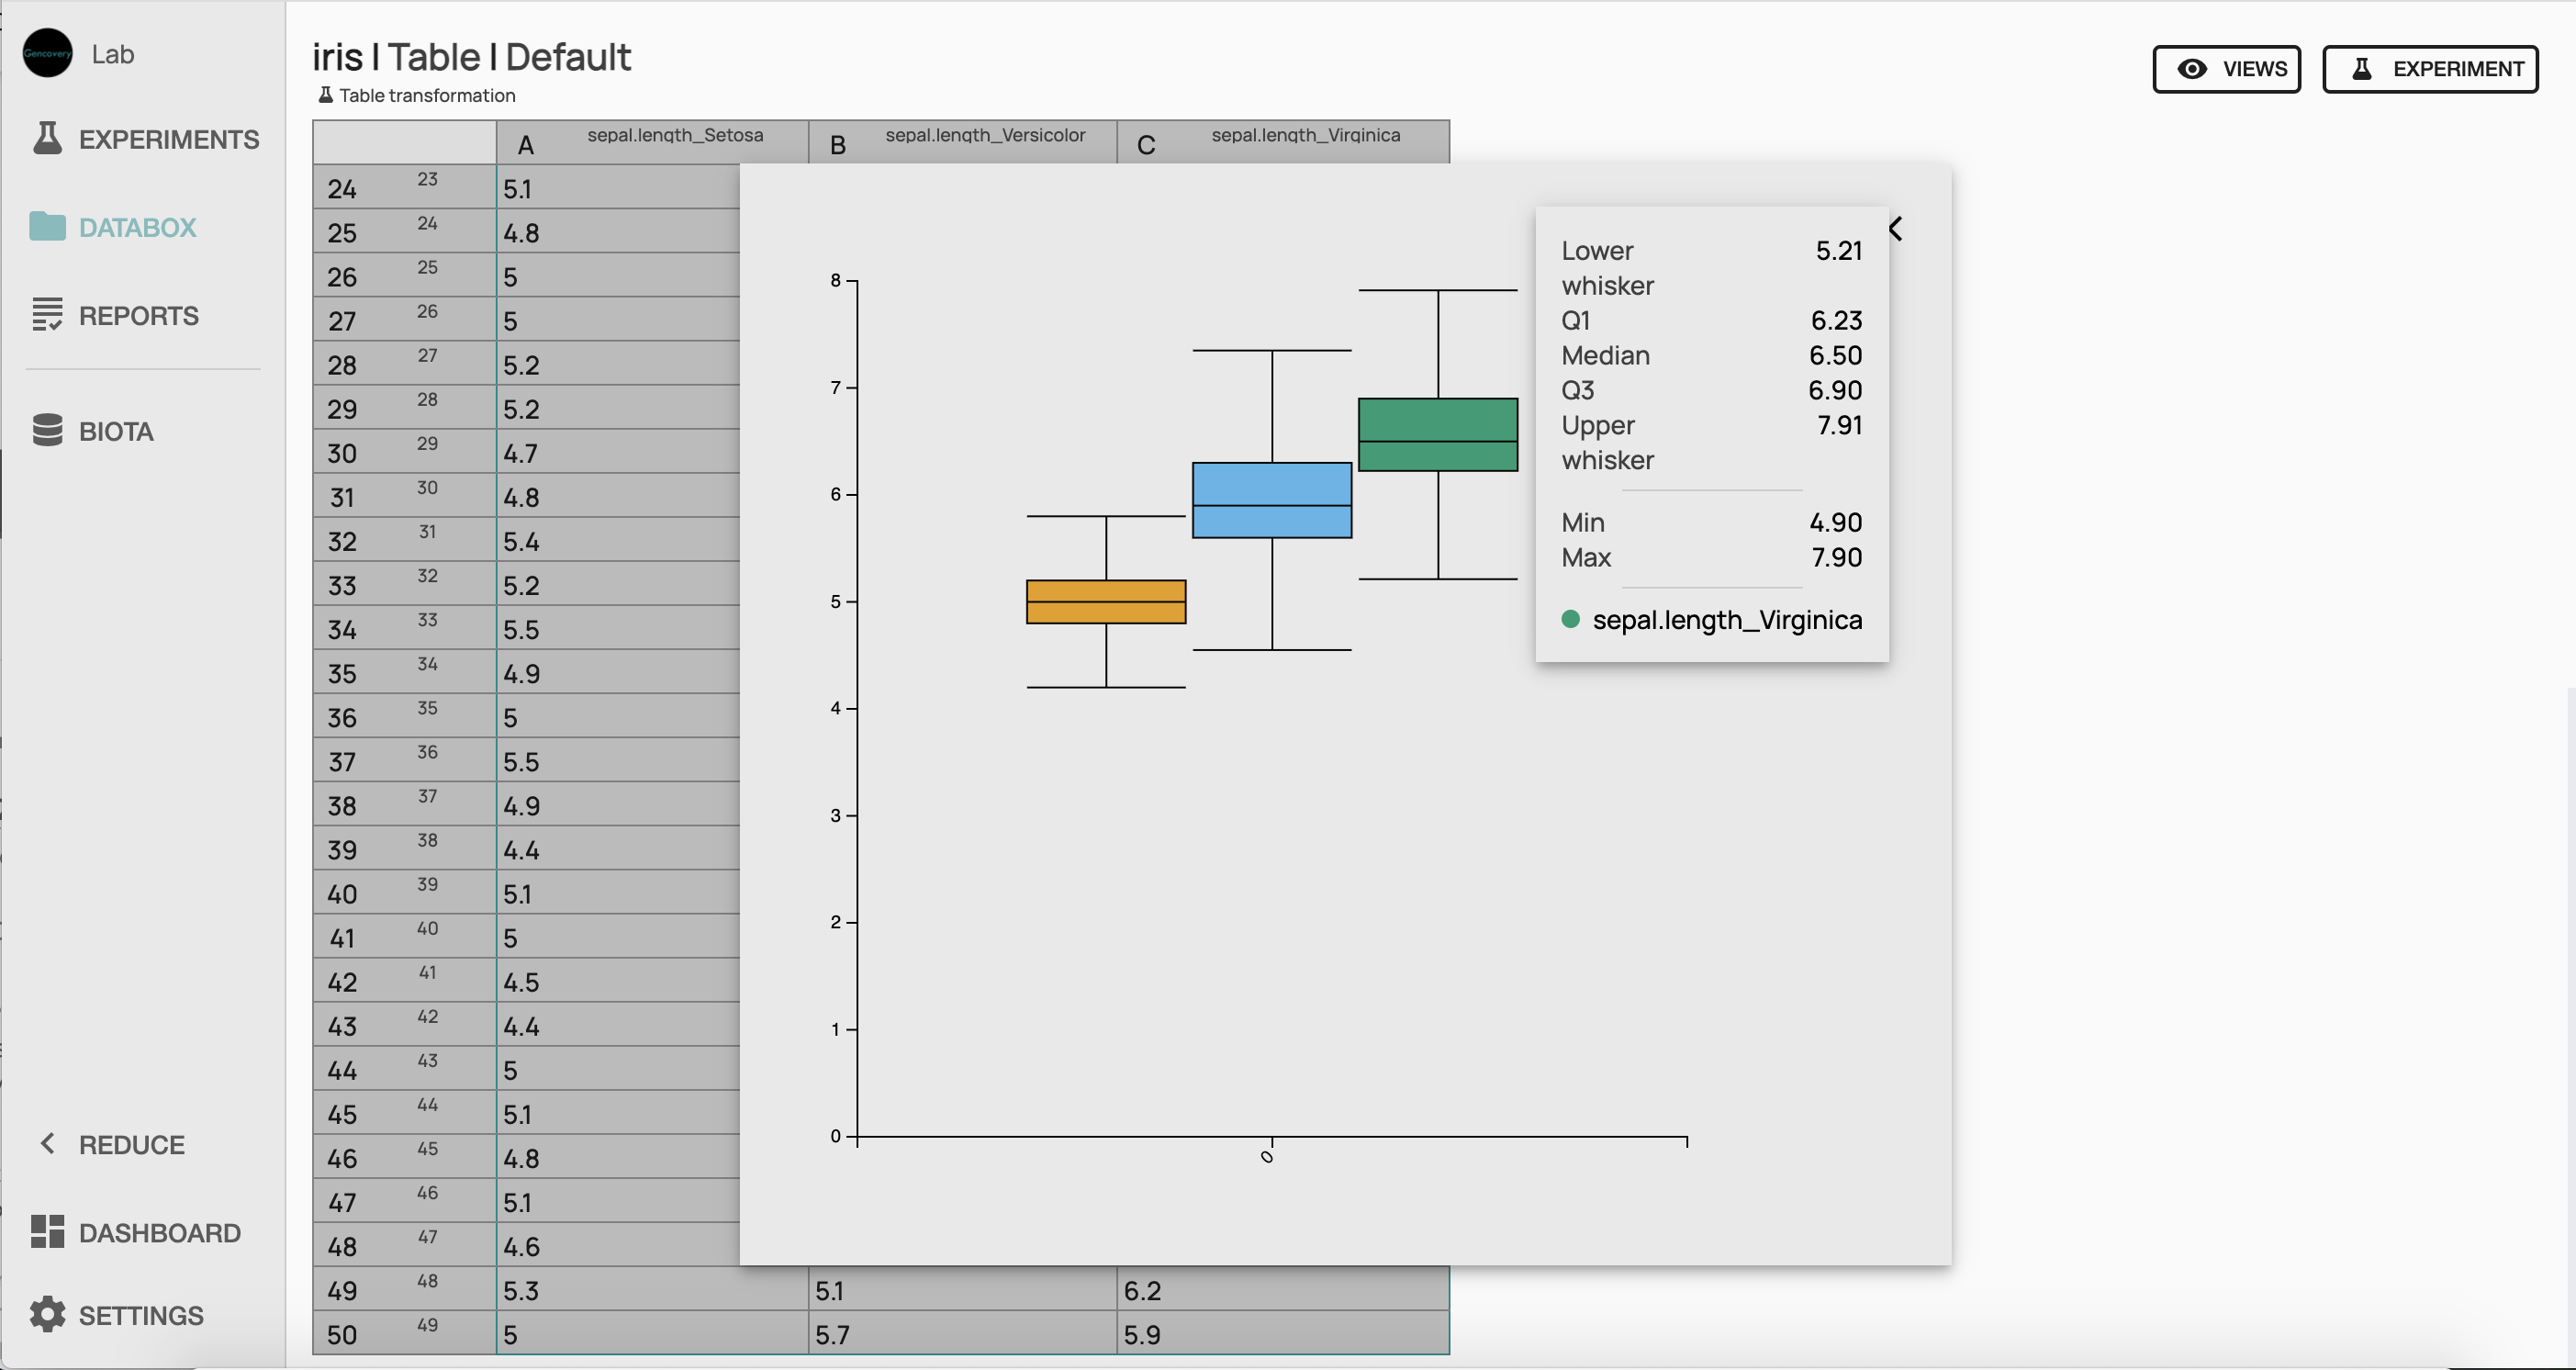
In order to have an overview of the distribution of our data, we can plot the distribution of our feature for each iris species with a boxplot chart. Looking at this plot, it appears that sepal length seems higher in average in Iris virginica than in Versicolor, while Setosa seems to have the lowest sepal length. In order to get a more quantitative assessment of the significance of these differences, we will perform a t-test analysis of our data.
 STEP 2 Building of the workflow for the T-test analysis
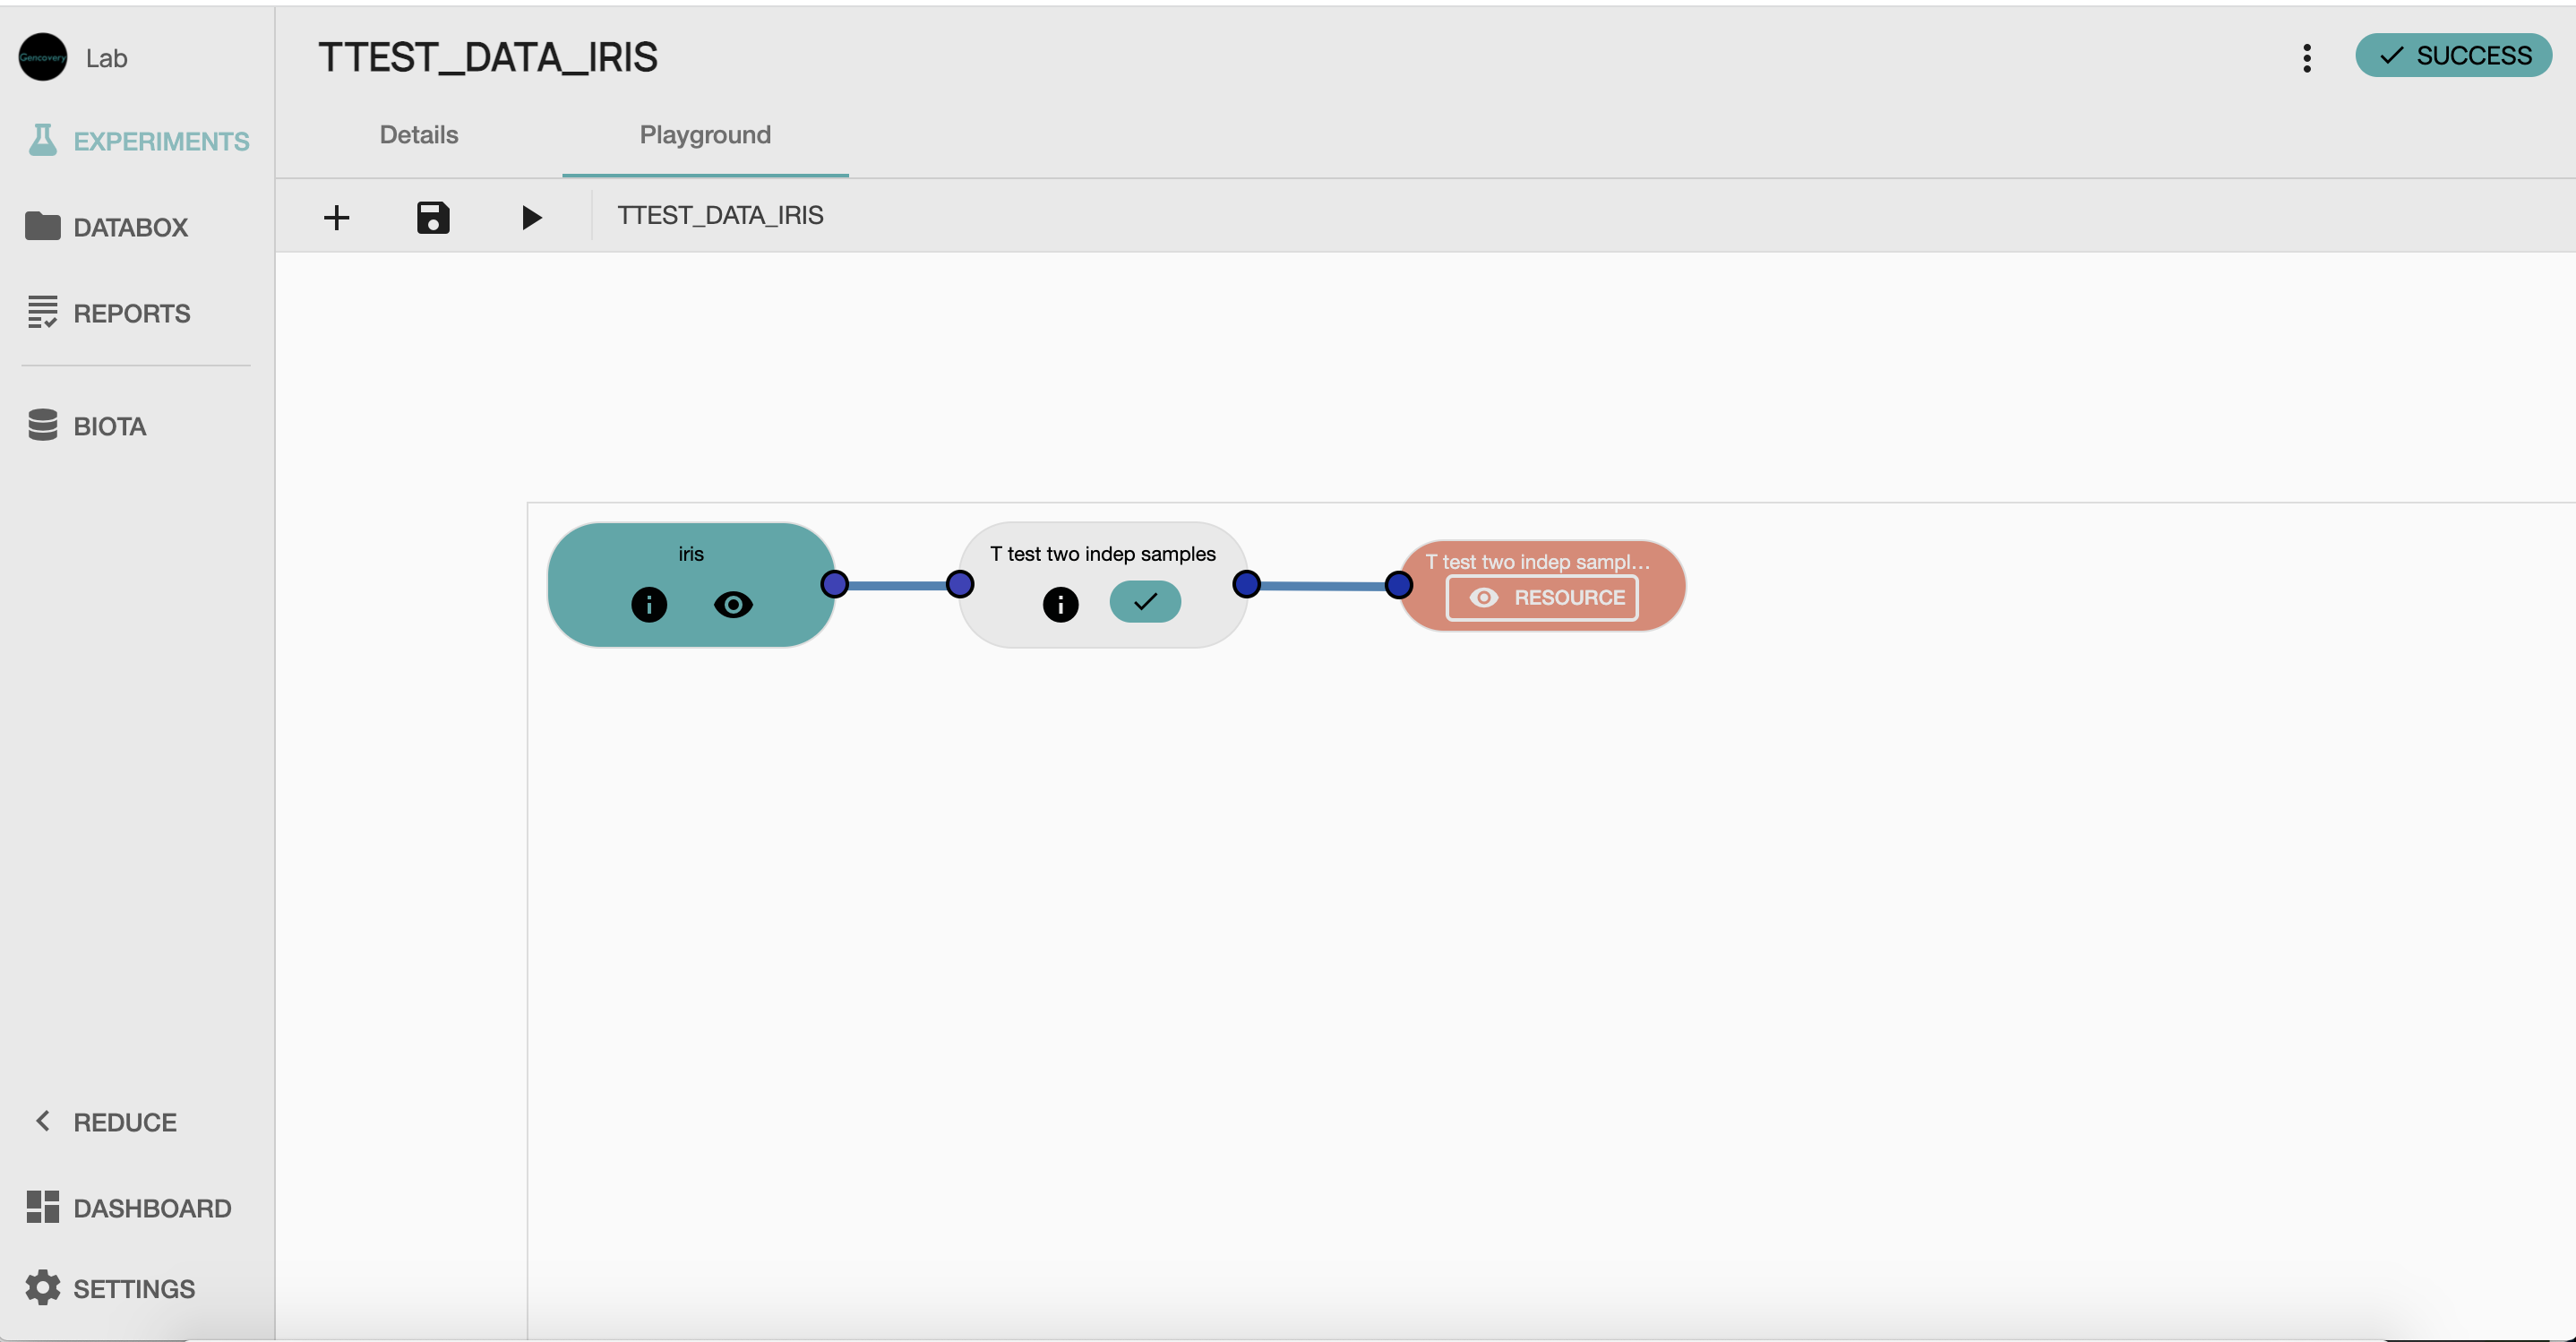
In order to perform our t-test analysis of the distribution of sepal length across iris species, we first create an experiment in which the workflow of our experiment will be built. We then construct the workflow that will be used for our T-test analysis, by selecting :
the t-test process from our STATS library (T test two indep samples,
- ) ,
- the resource containing our processed data as input data, and
- the output process which will collect the result of our analysis.
 STEP 3 Running of the T-test workflow analysis and viewing the results
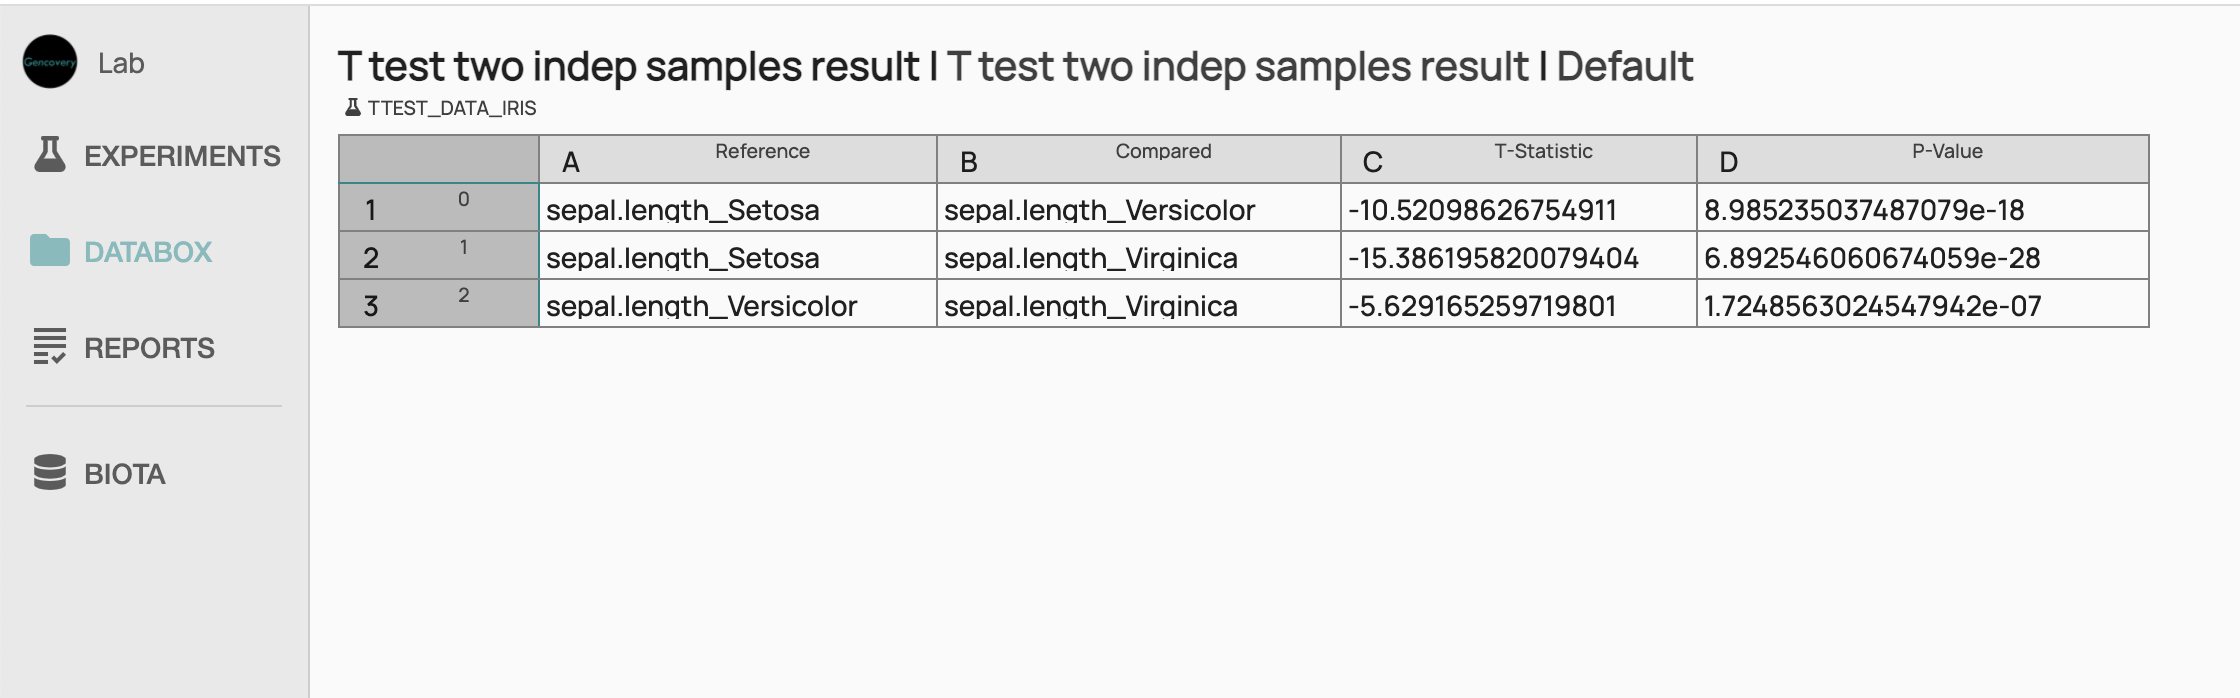
We can now run the experiment which will perform the T-Test Analysis of the processed Iris dataset. Once the experiment has been successfully run, we can view the result of the analysis in a tabular form, showing the pairwise t-test analysis of the sepal length between species. We see that the p-value for each pairwise analysis is very low showing there is a significant difference in sepal length between the species.