Debug code
You can debug any code of the python app. In dev mode, any action triggered on the web interface can be debugged.
This is a real VsCode running so you can find plenty information online on how to use the VsCode. for example here is the official documentation for debugging : https://code.visualstudio.com/docs/editor/debugging
Debug experiment
One useful thing to debug are experiments. With this you can debug your tasks. In codelab open the task file you want to debug and set a breaking point in the line you want. A breaking will stop the code execution each time the program reaches the line of the breaking point.
To create a breaking point, simply click on the left of the any line number that is executable:
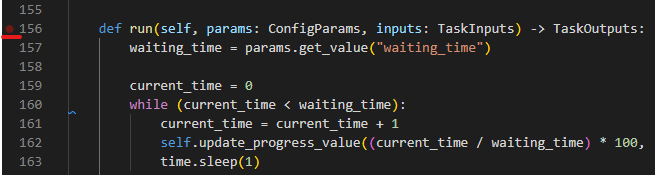
A small red dot should appead which mean that the breakpoint is active.
Once you breakpoint is set, the execution will stop there whenever this line is executed.
To trigger the execution, go back in the web interface and create an experiment that uses the task you want to debug. When you will run your experiment, the breakpoint shloud be activated.
See Debugging section to see how to use the debugger.
Debug other
With the breakpoint you can also easily debug anything like the Resource views. Simply put the breakpoint in you view code and show the view in the web interface. Your breakpoint should be activated.
Debug tests
To debug a test, you must open the codelab in the folder of the brick you want to test. Once the codelab opened in the correct brick there should be Test a single fileoption to run
When you execute this, the codelab will ask you for the test file name. Enter the file name of the test you want to execute, and press Enter. If the file exists on the brick and is a test, the code should be executed and if there any breakpoint in your test file, the execution should stop there.
Debugging
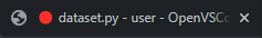
You can see that you reached a breakpoint on the browser codelab tab where there is a red circle.
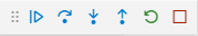
On the codelab you should see that button of the small popup are enable
You should also see a yellow line on the current execution line and the “Call stack” section of the left that is provided with information.
In the bottom section, aside the terminal tab you have a DEBUG CONSOLE tab. This section is useful. There, you can write any python code, to see variables, update them or call function.
Finally, you can use the small popup to continue the execution of execute the code line per line.
List of breakpoints
On the bottom left of the screen, you can see the list of breakpoints :
You can disable or delete them from here.
Breakpoint on exception
By default VS code stop the code execution when an uncaught exception occurs. For exemple, when an exception occurs on a task the program will be stop on exception raise to improve debugging. You can disabled that by uncheking the check-box « Uncaught Exceptions » on the bottom left.
