Constellab has hundreds of tasks, gathered by bricks. However, a task can be missing to complete a pipeline - or maybe we don't find out the right task - and we had no time for learning how to develop a task from scratch using Codelab. We can also be unsatisfied by an output, and we need to generate a new table or a new figure.
Few days ago, clients ask for help. They were closing a new publication, but the composition plot generated by a task in gws_ubiome did not meet their expectation mainly because of the format of the legend. To solve this problem, the R/Python live task is a very good option. It is very fast to deploy (it took less than 15 minutes to integrate the code) and it is also as reproductible as any other task.
Let's see how it works. First you have to export the data table in which you want to work for. The task "Table exporter" will do this job, using default parameters.
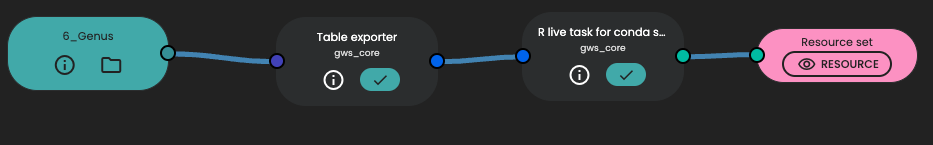
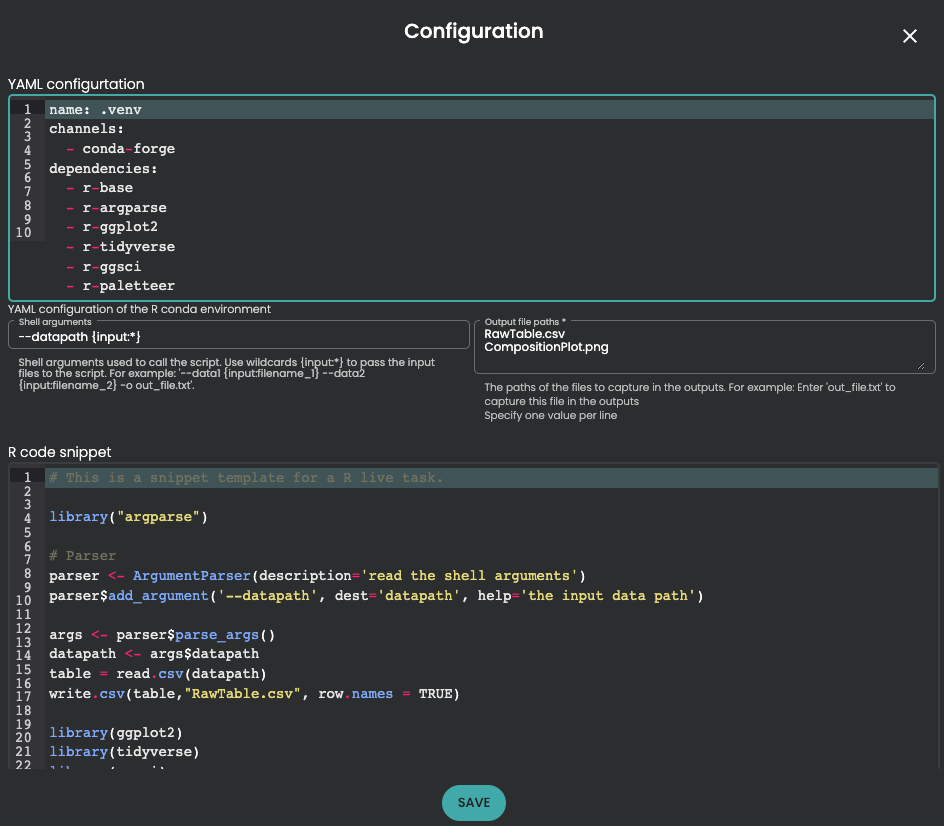
Then you can use for example the task "R live task for conda"' if you want to code with R. If you are Python advocate, you can use for example "Python live task for conda". Then you need first to configure the YAML section, define the shell argument to the input (with --datapath {input:*} and output file paths. Be careful about Output file paths, this section is mandatory and you need to specify one value per line according to the output you want to return in a Resource Set.
At this step, it's always done ! Because you are an R (or Python, okay...) expert, you will add your best fitted code to be executed. Your code should start with few files using a parser.
library("argparse")
# Parser
parser <- ArgumentParser(description='read the shell arguments')
parser$add_argument('--datapath', dest='datapath', help='the input data path')
args <- parser$parse_args()
datapath <- args$datapath
table = read.csv(datapath)
write.csv(table,"RawTable.csv", row.names = TRUE)
Now you can start your own live task in Constellab !

Comments (0)
Write a comment