Introduction
The PMO Dashboard is a streamlined, interactive web application designed to support project management activities across multiple teams. Built using Streamlit, this dashboard helps project managers and stakeholders track project progress, visualize key indicators, and streamline communication around task statuses and resource allocation.
Whether you're overseeing a portfolio of projects or managing a single complex initiative, the PMO Dashboard centralizes the essential data you need to make informed decisions in real time.
🔧 Core Functionalities
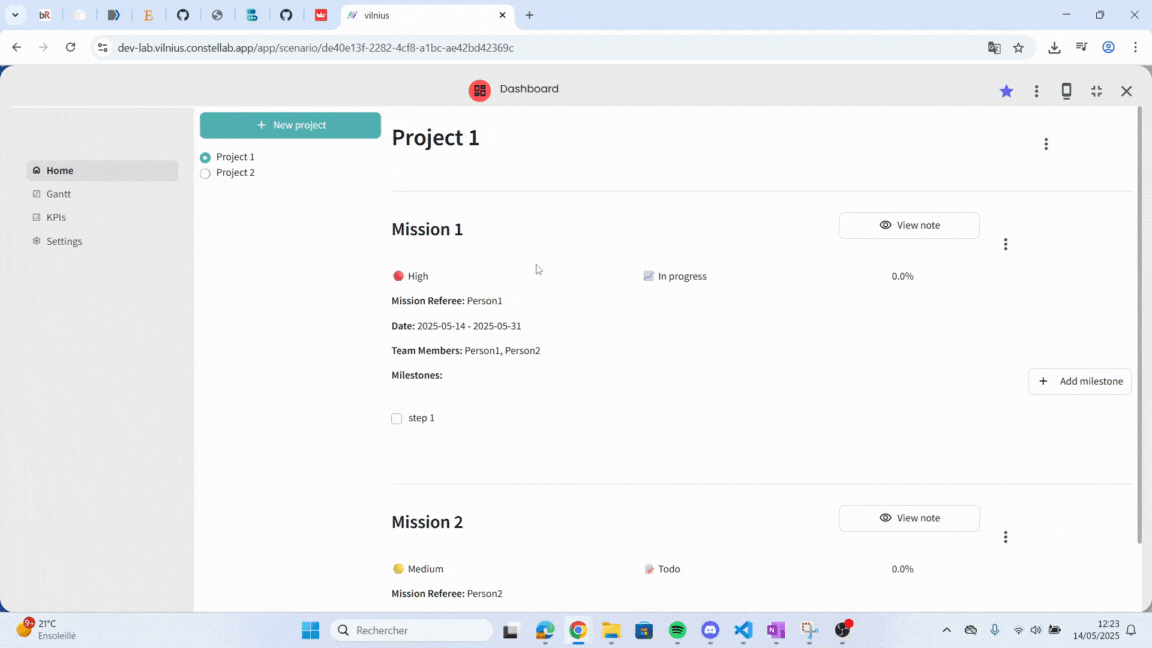
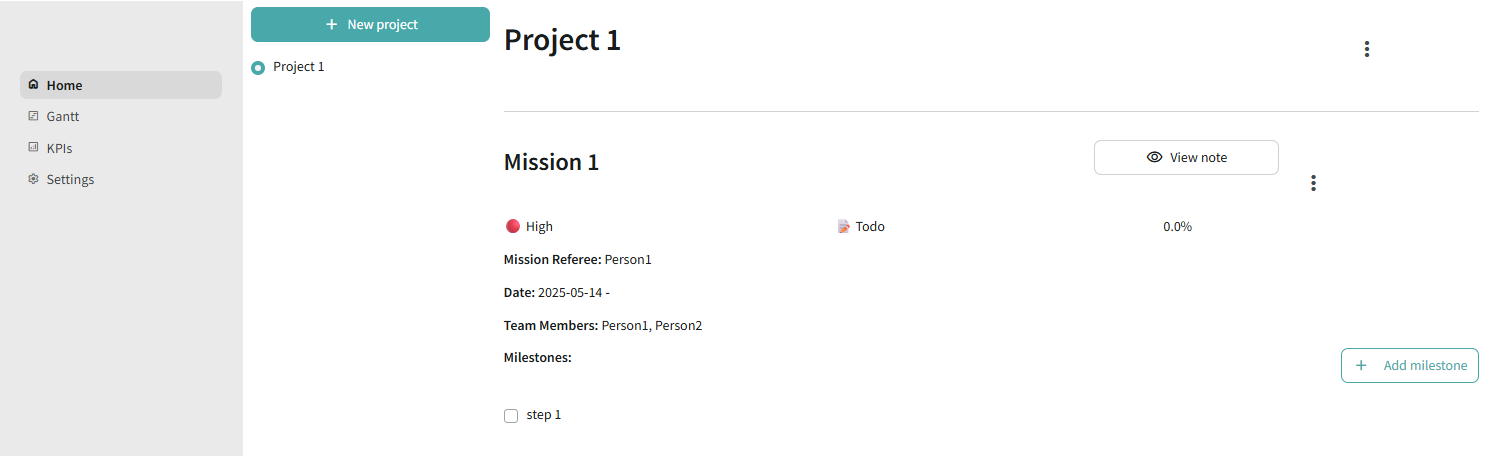
1. Global Overview
- View a high-level summary of all projects.
- For each project you can see:
- The associated missions
- Status of each mission (✅ Done, 📝 Todo, 📈 In progress)
- Priority of each mission (🔴 High,🟡 Medium, 🟢 Low)
- The progress in percentage
- Dates
- Notes enriched with information relating to each mission.
- Milestones
- Persons associated to each mission
- Editable interface to:
- Update task statuses
- Assign team members
- Modify deadlines
- And much more...
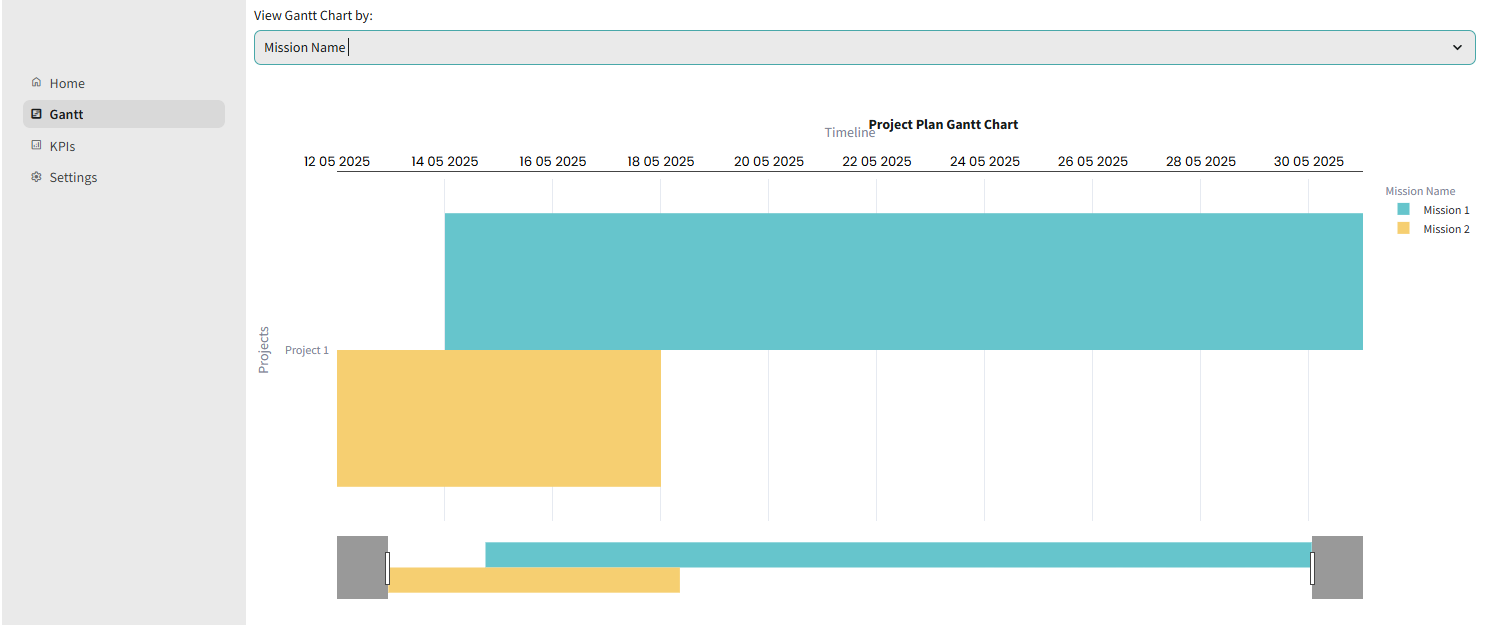
2. Interactive Gantt charts
- Visualize project timelines with task breakdowns.
- Group and sort projects by different indicators, such as:
- Mission name – to focus on the structure of a single project
- Team members – to monitor individual workloads
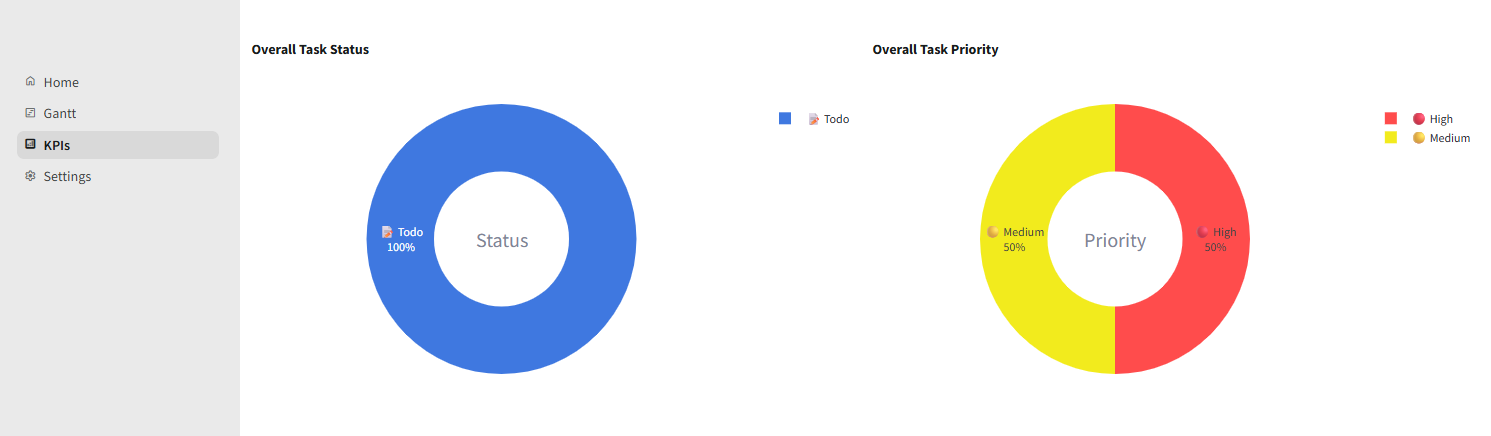
3. KPIs Visualisation
- You can quickly access your KPIs by viewing the status and priority of your projects through donut charts.
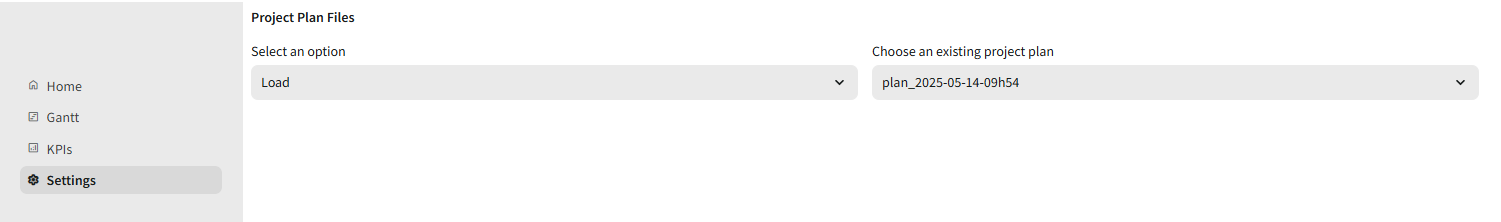
4. Settings
- Import data from JSON files
- Save and reload sessions
Test it in your lab!
Simply add an empty folder to the task in your scenario, connect it to the PMO dashboard task, then run the scenario.
Once the process is complete, open the PMO Dashboard — and start managing your projects!
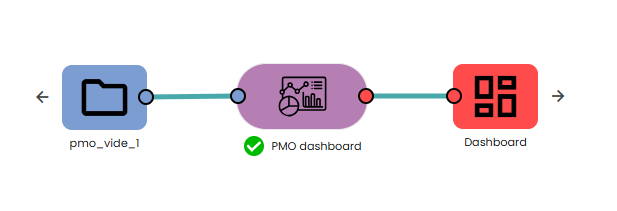
You can use this folder: